0
0
10
1.0
20
30
1.5
40
2.0
50
0
10
20
30
40
50
W
E
Distance (m)
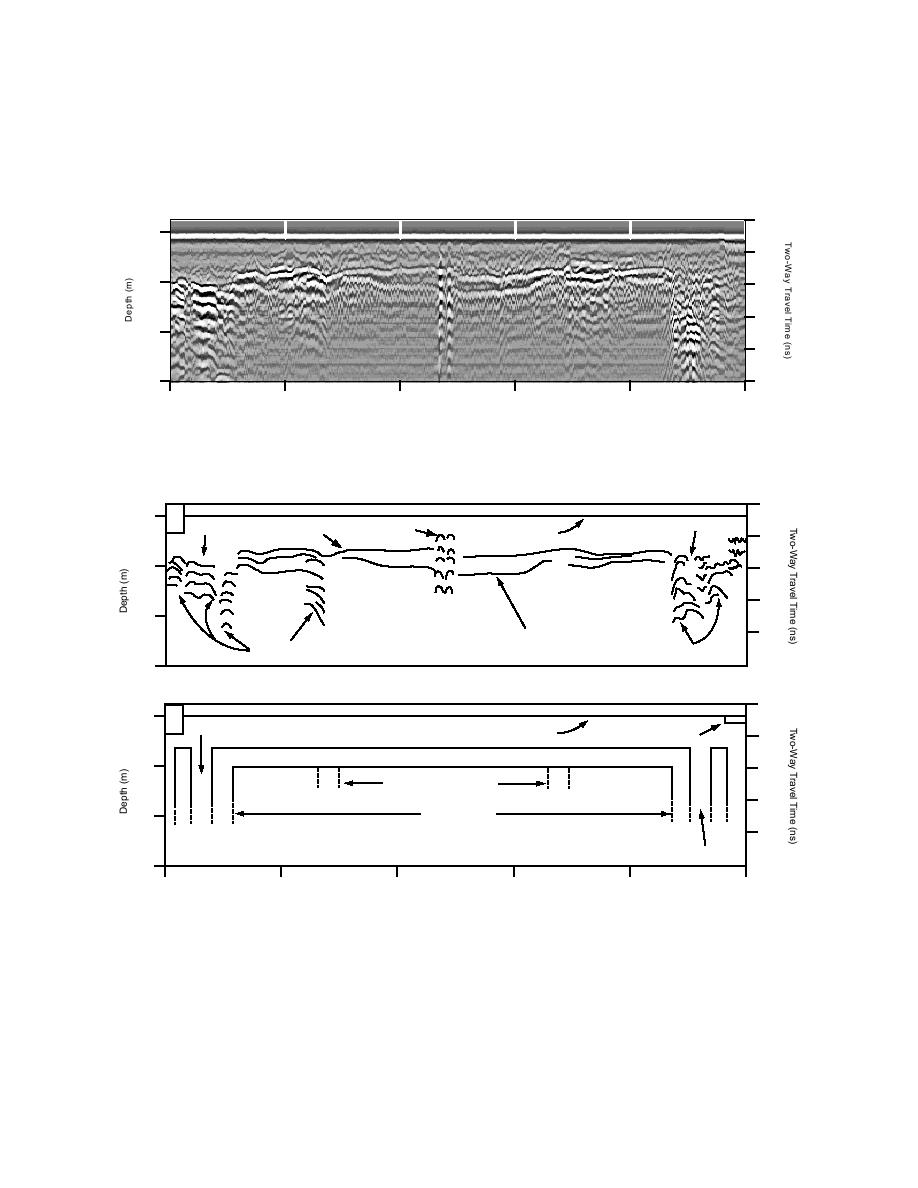
Figure 13. 400-MHz profile recorded along transect 3.
0
a.
0
Shallow
Utilidor
Top of Slab
Utilidor
Ground Surface
10
1.0
20
30
1.5
40
Reinforcement Mat
Edge Effects
Edge Effects
2.0
a. 400-MHz profile.
0
b.
0
Utilidor
Annex
Fill
Ground Surface
10
Foundation
1.0
20
Zone of Reinforcement
(Inner Bunker)
30
Main Bunker
1.5
40
Utilidor
2.0
W
E
0
10
20
30
40
50
Distance (m)
b. Annotated sketch.
Figure 14. Interpretive depth sections for transect 3.
13


 Previous Page
