0
a.
0
100
4
200
8
300
12
0
10
20
30
40
50
60
Distance (m)
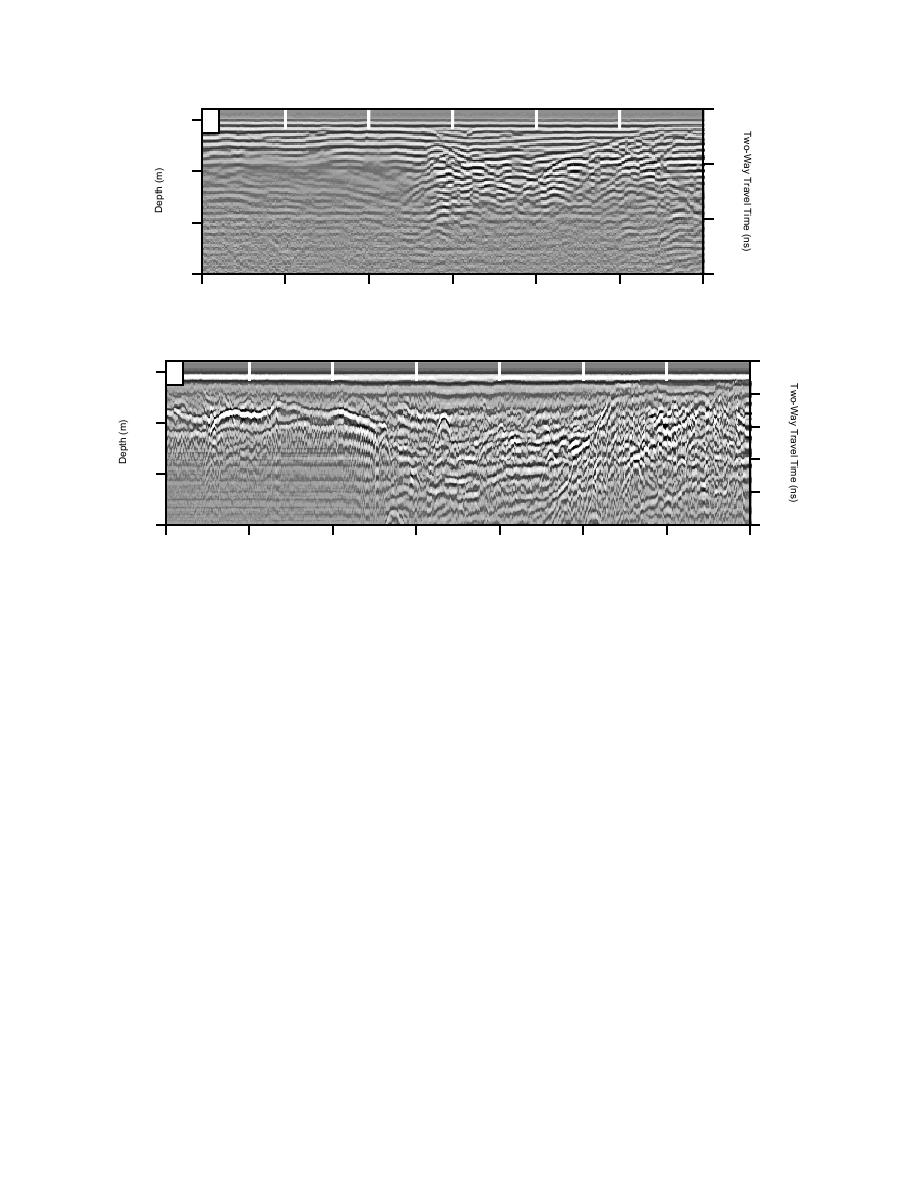
a. 100-MHz.
0
b.
0
10
1.0
20
30
1.5
40
2.0
50
0
10
20
30
40
50
60
70
W
E
Distance (m)
b. 400-MHz.
Figure 15. GPR profile from transect 5.
1. The 100-MHz antenna provides general de-
sent natural depositional surfaces as described on
tails on larger subsurface structures, while
transects 2 and 5 (Fig. 12, 13, 15, and 16). We inter-
the 400-MHz antenna defines features at
pret this high-amplitude reflector as the lower
shallower depth and in greater detail.
excavation surface that became compacted during
100 MHz: delineates limits of excavation,
bunker construction. The hyperbolas recorded at 50
presence of buried structures, and large-
m distance likely record a utilidor that extends to
scale stratigraphic horizons.
the power control hut to the north (Fig. 2). Other
400 MHz: delineates shallow excavation
coherent reflectors probably reflect sequential hori-
surfaces, buried pipes, inner and outer
zons produced as the site was backfilled.
walls of buried structures, and utilidor
walls and floors.
2. Vertically stacked hyperbolas in the GPR
SUMMARY
data represent edges of the concrete walls of
the bunker and utilidors.
Our investigations of the Roosevelt Road Trans-
3. Multiple, closely spaced hyperbolas in the
mitter Site show that GPR can delineate under-
400-MHz data reflect the wire mesh used to
ground structures and associated excavation sur-
reinforce the concrete in the bunker ceiling.
faces. The technology has broad application for
4. Strong subhorizontal reflections that truncate
investigating buried underground structures and
anthropogenic surfaces. The analyses presented in
apparent depositional surfaces reveal com-
pacted surfaces produced when the site was
this report demonstrate the utility of using GPR
data to delineate such features. The following is a
excavated and backfilled.
summary of our observations:
14


 Previous Page
