0
0
18+00
18+00
18+00
Center
Right
Left
100
5
200
10
300
15
400
500
20
0
0
16+00
16+00
16+00
Center
Right
Left
100
5
200
10
300
15
400
500
20
100 1
10
100 1
10
100
1
10
CBRDCP Profile
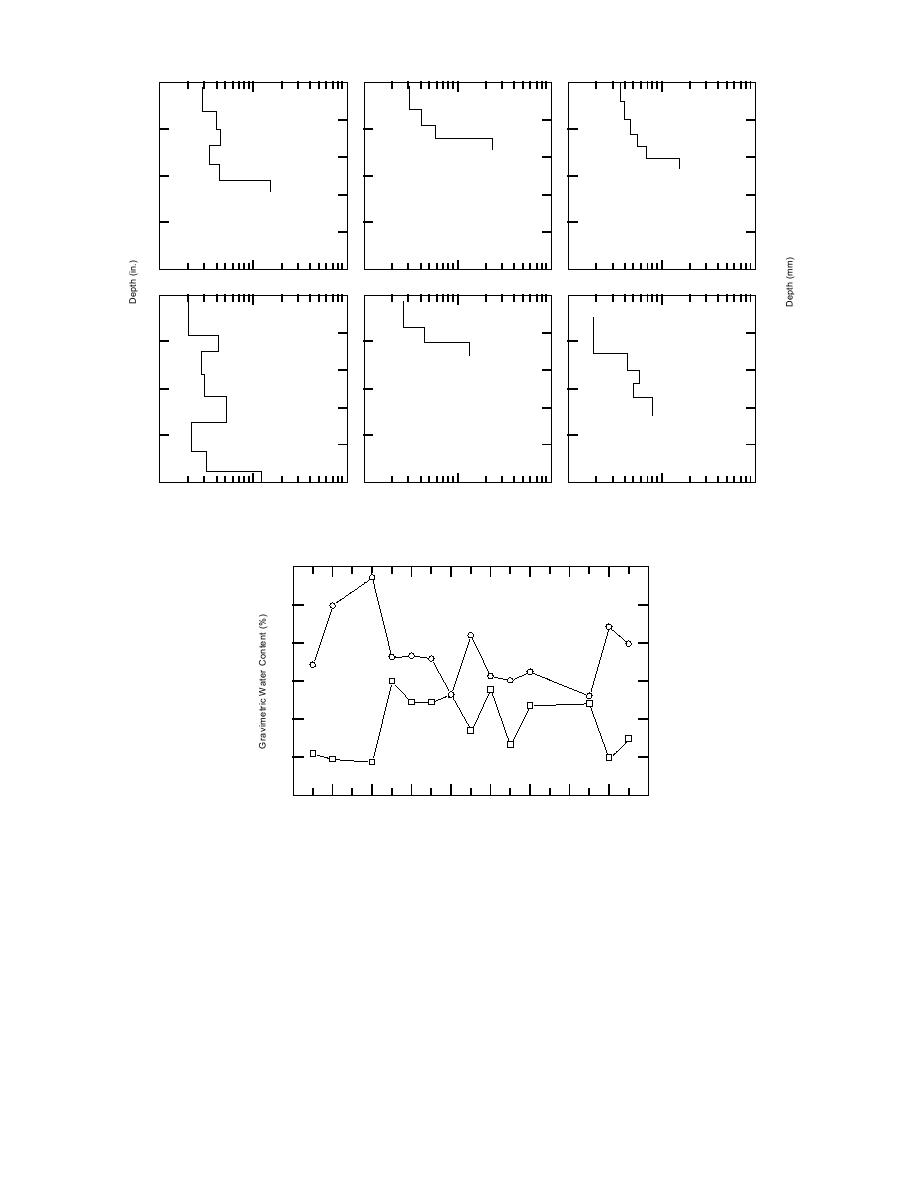
c. Typical CBRDCP profiles--wooded trail.
40
CBRCLEGG
35
30
25
20
Gravimetric Water Content
15
10
0
200
400
600
800
1000
1200
1400
1600
1800
Station
d. Gravimetric water content and CBRCLEGG--wooded trail.
Figure 1 (cont'd). Water content and CBR.
In contrast to the wooded trail, the soil on the
cone, all indicated that the native material was
pentagonal loop trail was unsaturated and no frost
also somewhat firmer than that composing the
was detected. Based upon soil sample tests, gravi-
wooded trail. Despite both visual uniformity and
metric water contents ranged from approximately
fairly uniform cone index values (from 015 cm
5 to 13%, and averaged 8% with a standard devia-
[06 in.], [App. A]), the pentagonal loop trail exhib-
tion of 2.2. The in-situ soil was the same as the
ited moderate strength variability. This variability
unimproved sections of the wooded trail. The "soil
was also shown by the cone index corresponding
hardness index" tests, e.g., CIT, DCP, and static
to depths greater than 15 cm (6 in.) (App. A).
9


 Previous Page
