0.50
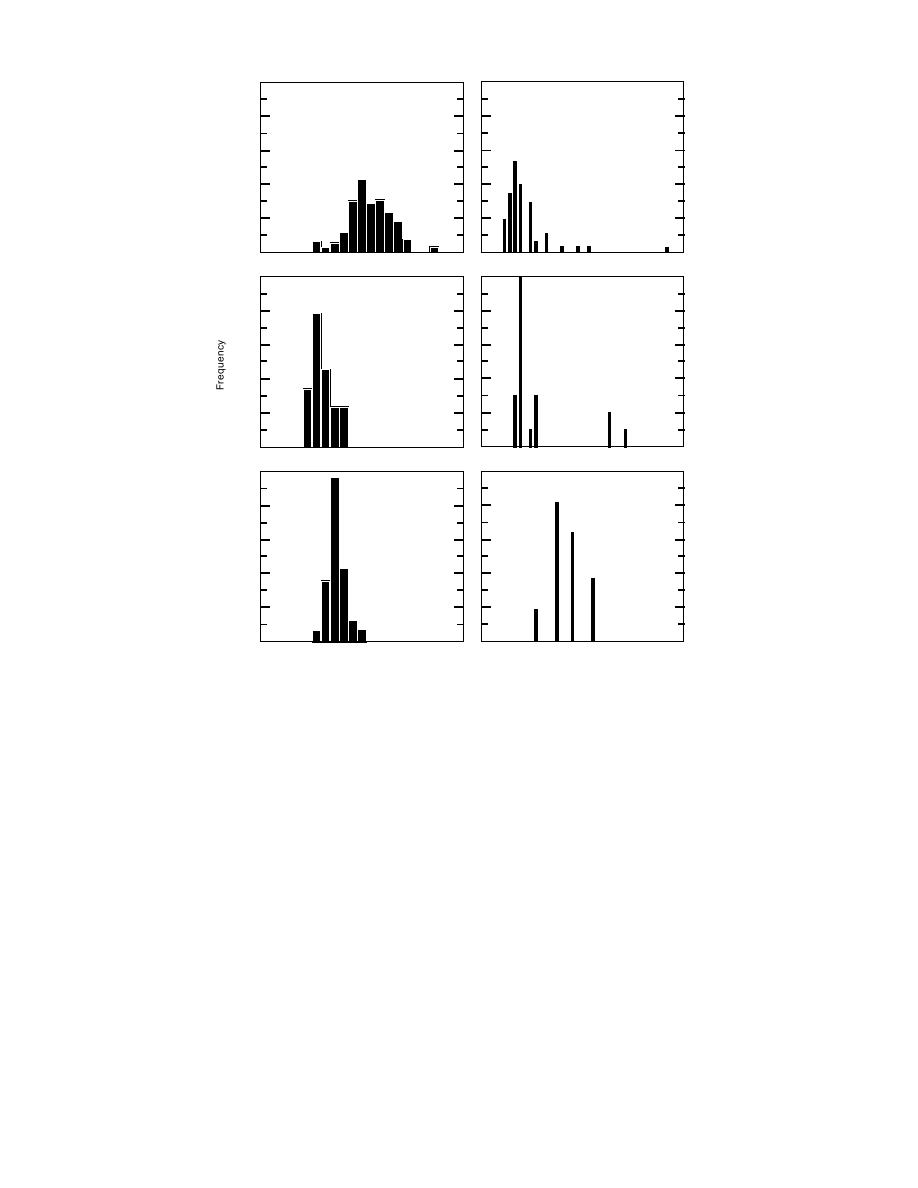
a(1) Wooded trail.
b(1) Wooded trail.
0.40
0.30
0.20
0.10
0.00
0
2
4
6
8
10
12
14
16
0
4
8
12 16 20 24 28 32 36
0.50
a(2) Corner trail.
b(2) Corner trail.
0.40
0.30
0.20
0.10
0.00
0
2
4
6
8
10
12
14
16
0
4
8
12 16 20 24 28 32 36
0.50
b(3) Slope trail.
a(3) Slope trail.
0.40
0.30
0.20
0.10
0.00
0
2
4
6
8
10
12
14
16
0
4
8
12 16 20 24 28 32 36
Gravimetric Water Content
b. CBRCLEGG histograms.
a. Gravimetric water content histo-
grams.
Figure 1. Water content and CBR.
trail (pentagonal loop trail) with approximately
fairly uniform volumetric water contents on the
north slope and highly variable water contents on
33-m- (100-ft-) long sides. Test sections were cen-
tered on the corners. The trail site was flat, open,
the east. Resistance to penetration ranged from
and grass covered. The native material consisted
approximately 5 to 300 mm (0.2 to 12 in.). How-
of a fine sand and was covered with a thin (0 to 8-
ever, this was primarily because of bedrock as
cm [0 to 3-in.]) organic layer. The gradation of the
opposed to a thawed/frozen interface. CBR for
fine sand is shown in Appendix A, Figure A3b.
the sloped trail was greater than that for the
wooded trail. As would be expected, the cone
Prior to site characterization and test section con-
index was higher in areas (near 0+00) where the
struction, the pentagonal loop trail was back-
depth to resistance was minimal. This, however,
bladed with a bulldozer to flatten small berms.
was not evident by CBRCLEGG.
However, earthwork was minimal and the thin
organic mat generally remained exposed during
construction. In contrast to the wooded trail site,
Corners: pentagonal loop trail
Performance on corners was evaluated by con-
all corner test sections were constructed on visu-
structing and trafficking a pentagon-shaped loop
ally similar terrain.
8


 Previous Page
