

^
summary, eq 4 yields good results for small values of α and β but leads to signifi-
^
cant errors if either one of them is 0.5 or more.
We tried this algorithm for predicting total cloud amount using the standard
meteorological data obtained on drifting station North Pole 25, which was above
85N from October 1982 to October 1983. Table 5 lists our results for the winter of
19821983, November through March. In the table, all the correlation coefficients
have a significance level below 0.13. In other words, based on the calculations sum-
marized in Table 5, the probability that eq 4 is a useful model for cloud amount in
winter is better than 87%.
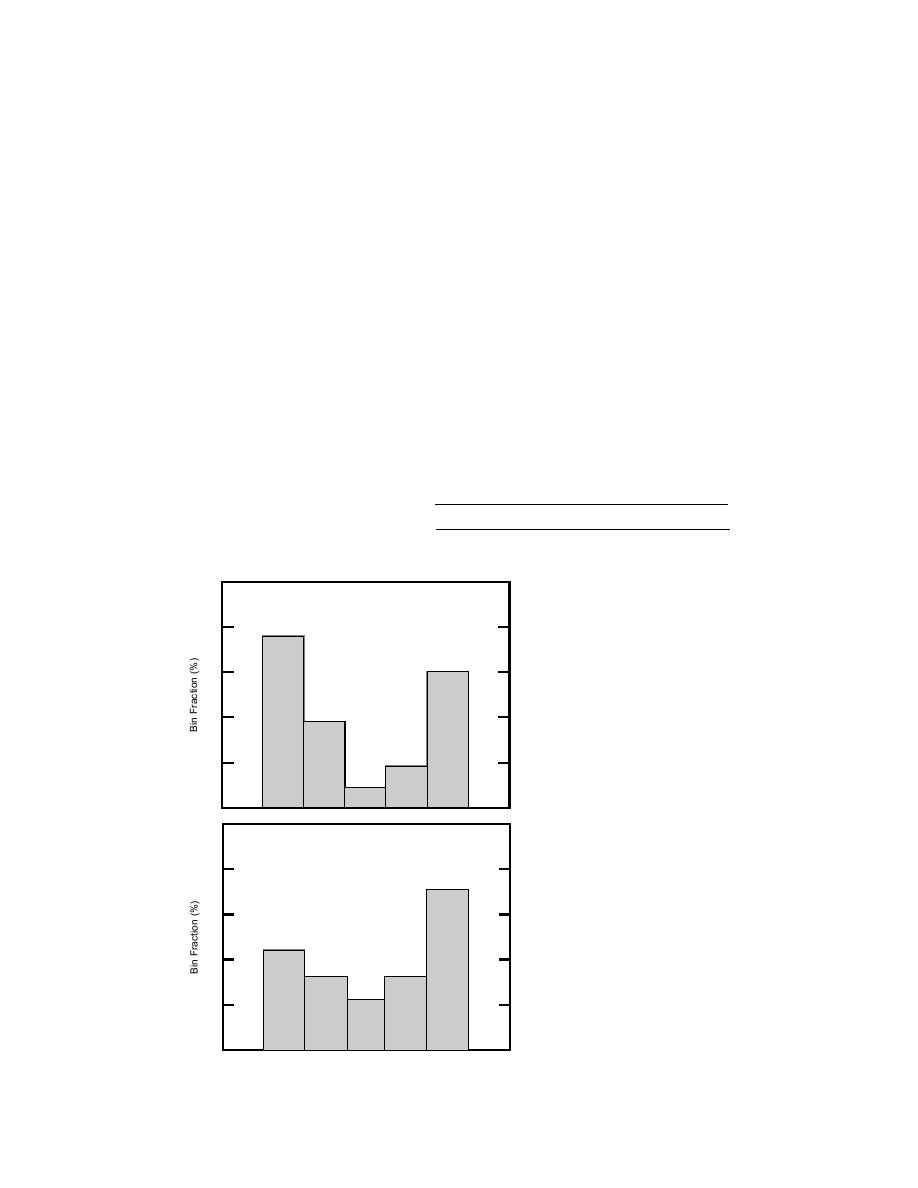
Figures 8 and 9 show other tests of our algorithm for estimating total cloud
amount using data from NP-25. Figure 8 shows histograms of the observed and
modeled total cloud amounts based on data collected on NP-25 in November 1982.
Figure 9 compiles 240 consecutive observations of total cloud amount and our
simultaneous estimates of total cloud amount based on eq 4. The figures show that,
^
using the α and β coefficients averaged from all data between 1955 and 1991 and
^
having observations of surface-
layer temperature on NP-25, we
Table 5. Correlation coefficients between the
have managed to capture with eq
total cloud amounts observed on North Pole
4 not only the U-shaped fre-
25 and cloud amounts estimated using eq 4.
quency distribution in total cloud
November December
January
February
March
amount but also, to an extent, its
0.54
0.31
0.57
0.42
0.57
temporal variability.
50
Observed
40
30
20
10
Figure 8. Observed and modeled
(using eq 4) total cloud amounts
0
based on observations and data
50
from North Pole 25 in November
Modeled
1982.
40
30
20
10
0
02
34
56
78
910
Cloud Amount (tenths)
12

 Previous Page
