70
02 tenths
February
60
50
40
30
20
10
0
80
810 tenths
70
February
60
50
40
30
20
10
0
1950
1960
1970
1980
1990
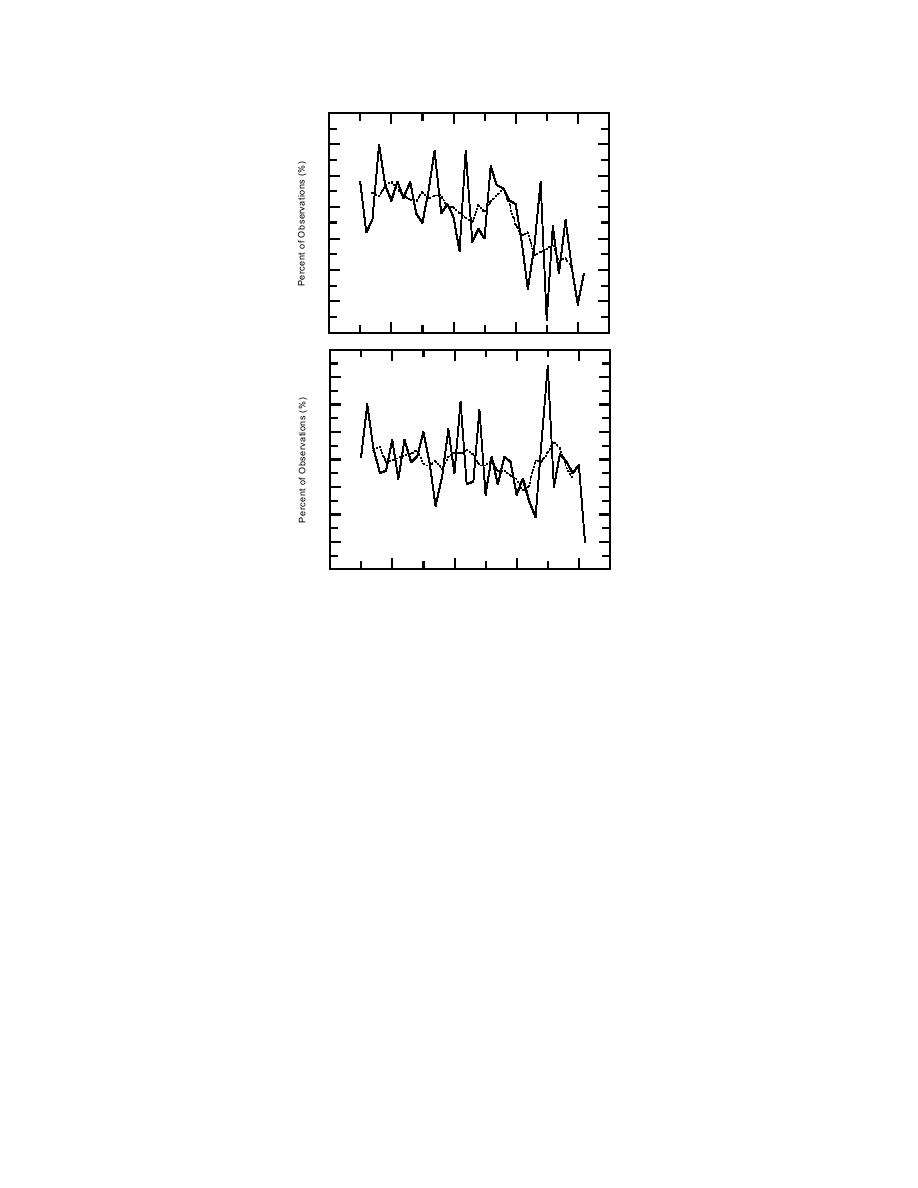
Figure 6. Observations for 19551991 of the fre-
quency of clear skies (02 tenths) and overcast skies
(810 tenths) in February on the North Pole drift-
ing stations indicated in Figure 5. The dashed curves
show the 5-year running means.
just in terms of the frequency of clear (02 tenths) and overcast (810 tenths) skies.
Using these criteria, we find an appreciable reduction in the frequency of clear skies
in winter (namely, February) between 1955 and 1991 but no significant change in
the frequency of overcast skies (Fig. 6). These observations imply an increase in
cloud amount in winter that is probably connected with the increase in aerosol
pollution in the Arctic atmosphere. After all, the concentration of aerosol pollut-
ants peaks in the late winter and early spring (Shaw 1995). The increased aerosol
concentration simply provides more cloud condensation nuclei.
Figure 7 shows time series of summer (namely, July) cloud observations and
global solar radiation, the latter coming from Marshunova and Mishin (1994). We
see here a reduction in the frequency of overcast skies in summer that is confirmed
by a corresponding increase in the global solar radiation measured on the same
drifting stations. These changes are probably related to changes in the mode of
the atmospheric circulation in the Arctic. On analyzing fluctuations in the Arctic
atmospheric circulation since 1963, Dmitriev (1994) documents a reduction in the
frequency of latitudinal air exchange and an increase in the frequency of zonal
processes. In other words, in recent years, fewer warm, moist air masses have been
entering the Arctic Basin, and, as a consequence, fewer clouds have been forming
in situ.
8


 Previous Page
