15
E
0E
30
74
66
79
71
86
73
63
80
81 78
85
87
67 61 64
89
82
72
57
69
180
0
55 75
68
56 88
60
58
70
59
83 84
90 62 76
65
77 91
30
W
W
0
15
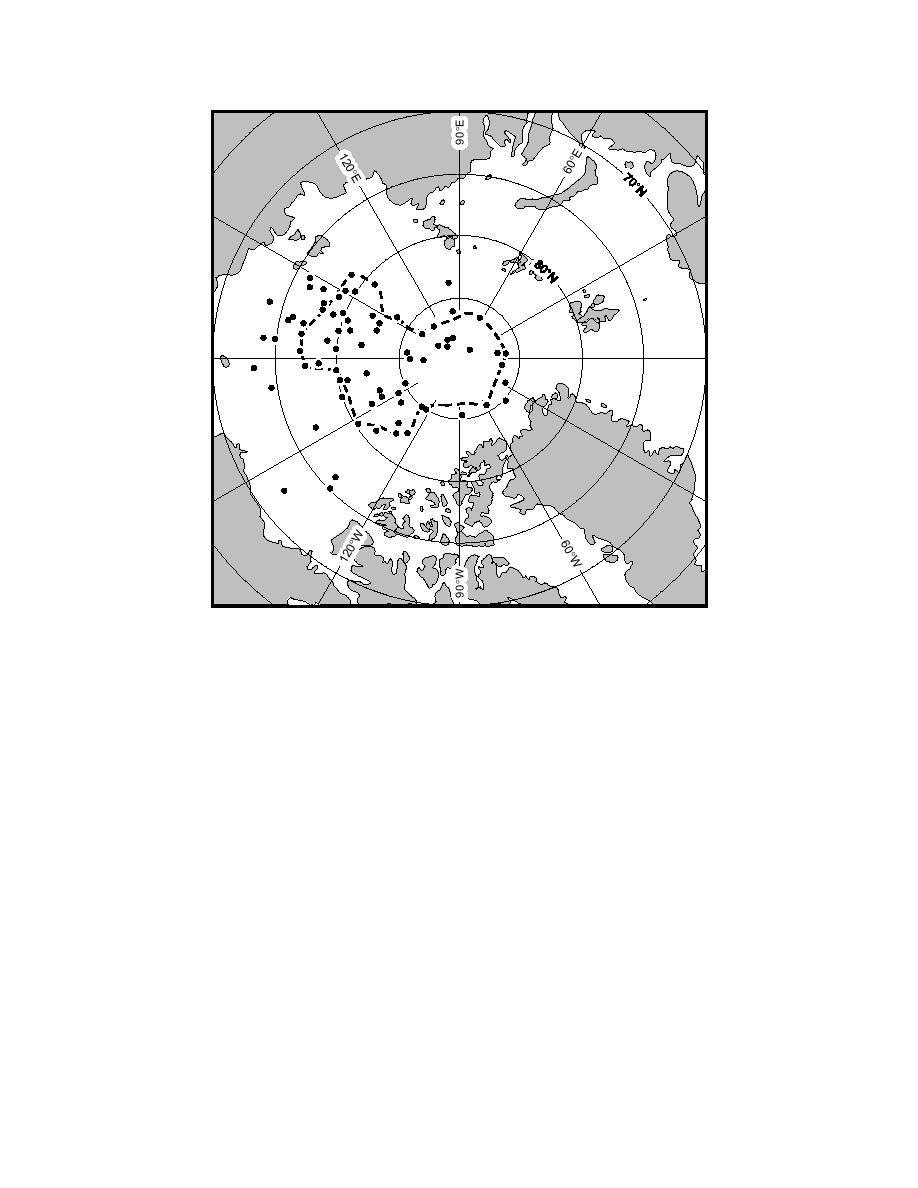
Figure 5. February positions of the North Pole drifting stations manned between
1938 and 1991. The dashed line encloses the region under study here. The num-
bers denote stations that contributed each year's data for our 19551991 analyses.
at the same time on different stations, we found significant correlations between
stations located in different regions. This seems reasonable in light of the obvious
uniformity of the surface and the distance the central basin is from continents and
oceans, where advection can foster inhomogeneity (Table 1).
In effect, we could thus assume that all stations in the central Arctic at the same
time were sampling the same cloud distribution. We thus created a time series of
cloud observations covering 19551991. But to keep the time series homogeneous,
we considered data from only one station above 77N each year. We use this series
for evaluating trends and making a more correct analysis of cloud characteristics
in the Arctic. Figure 5 shows the area on which we focus our analysis, the Febru-
ary position of all the NP stations, and the locations of the stations that yielded
the data year we used in our analyses. The figure confirms that the stations pro-
viding our data were randomly distributed around the central Arctic.
As we explained above, total cloud amount and, to a smaller degree, low cloud
amount have U-shaped distributions, unlike air temperature, which has a normal
distribution. This means that it is incorrect to describe the characteristics of a time
series of total or low cloud amount with the arithmetic average, as was done, for
example, in the Gorshkov (1983) atlas. On the basis of Tables 2 and 3, it also seems
appropriate to describe the spatial and temporal variability of Arctic cloudiness
7


 Previous Page
