content analyses were performed on sediments
farther from the spoils outfall. It is postulated that
the values will reflect those of the sediment
removed at the greater dredged depths and should
be quite low.
WP particle plug attenuation
On 28 September 1995, after draining the reten-
tion basin, manufactured particles of white phos-
phorus (M.E. Walsh et al. 1995) were planted in the
dredge sediments at four locations in the basin to
monitor attenuation of a known quantity of white
phosphorus in the basin sediments over time. A
single manufactured WP particle, approximately 2
mm diameter, was inserted in a plug of sediment
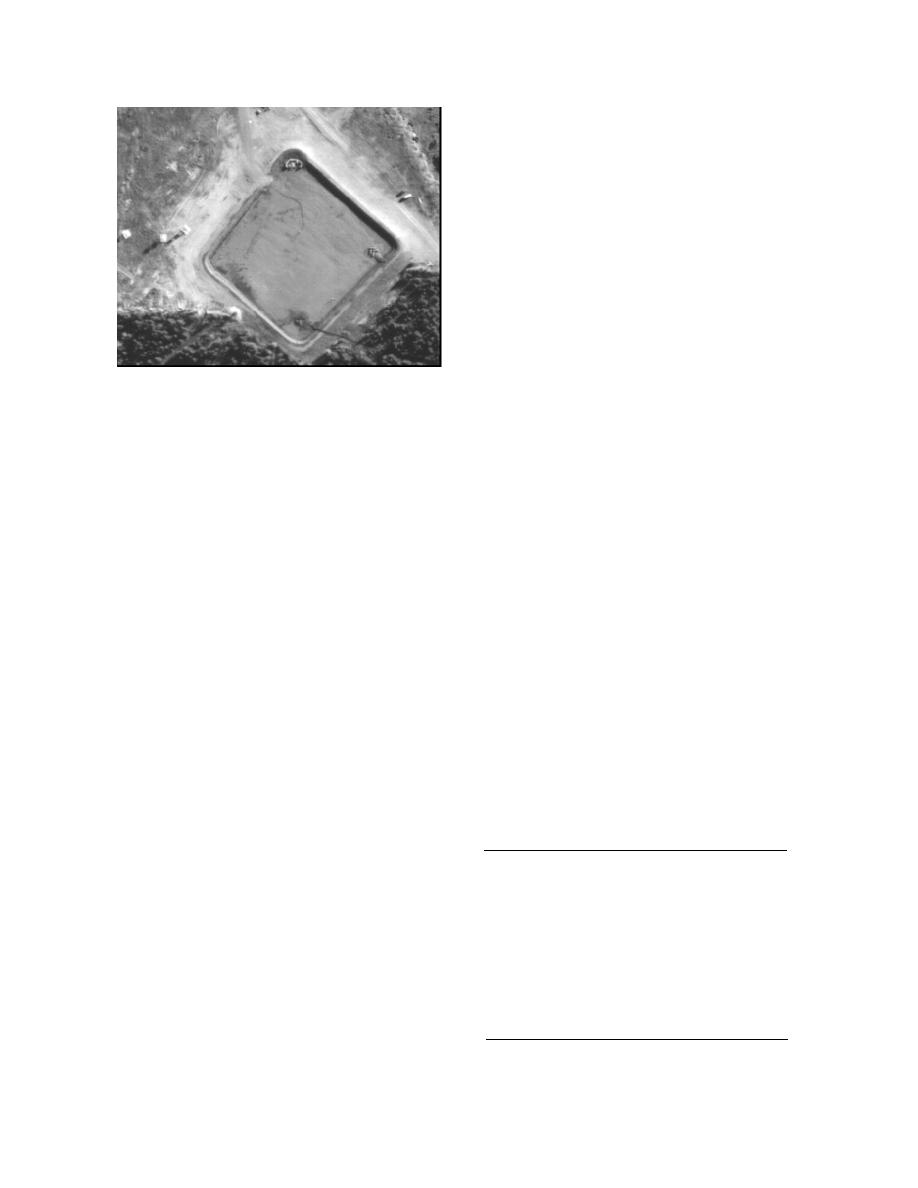
Figure 15. Retention basin.
contained within a nylon mesh bag. Six plugs were
planted at each of the four locations. Using other
after the winter season, with moisture contents of
data such as sediment moisture content, organic
up to 105% (Table E1). The exceptions are those
content, and temperature, the efficacy of using the
sample points near Station 1 where sediment
basin for natural remediation of white-phosphorus-
thickness is least. Here, moisture contents were in
contaminated sediments can be determined.
the 10% to 20% range (dry weight basis). The sed-
In May 1996, before dredging resumed, three
iment in these areas is also mostly mineral, with
plugs from each of the four locations were pulled
very little organic material evident. This results in
by Marianne Walsh for analysis at CRREL. At that
quicker drying times. For sublimation to occur,
time, the sediments were still partially frozen and
moisture content levels must be below approxi-
temperatures were averaging below 7C, going
mately 45% (dry weight basis) (M.E. Walsh 1995).
below 0C at night. Very little of the warm drying
conditions necessary for the initiation of the subli-
Organic contents
mation process was seen between the end of Sep-
As organic content of the sediments directly
tember 1995 and the end of May 1996. Table 10, the
affects the drying rate, two samples were obtained
results of the analyses on the plugs, reflects this.
from the basin, one near the spoils splash pad and
These results are very similar to the results ob-
one from the basin liner. These samples were sub-
tained in studies conducted in intermittent pond
divided and analyzed at CRREL for organics . The
areas of ERF (M.E. Walsh et al. 1995). As the sedi-
samples were first dried in an oven at 105C until
ments approach desaturation, individual particles
the moisture was driven off. Portions of the sam-
ple were sieved with a no. 30 sieve prior to analy-
sis. Samples were analyzed in a Leco CR-12 fur-
Table 10. Analysis results for P4-spiked plugs
nace using the methods outlined in Merry and
in basin.
Spouncer (1988). Analyses included both the
WP mass found
sieved and unsieved portions of the original sam-
(g)*
Site
Rep
% remaining
ple. Replicates of both the sieved and unsieved
analyses were run. The weights of two samples
Station 1
a
not detectable
0.00
b
7.80
0.14
were measured to verify the ranges of the carbon
c
not detectable
0.00
contents. Data and results are found in Appendix E.
Station 3
a
4400.0
80.59
The average for the five samples used in these
b
0.14
0.0026
analyses is 4.3%, the median 4.4%, and the stan-
c
0.17
0.0031
dard deviation 0.3. The organic contents of the
Mid inflow pipe
a
4690.0
85.90
b
3308.0
60.60
sieved and unsieved basin sediment samples are
c
629.0
11.50
in the same range as those found by Bouwkamp
Fence corner
a
32.0
0.59
(in Racine and Cate 1995). In Bouwkamp, 36 of 42
0.2†
b
0.0037
samples analyzed had organic carbon contents in
c
4402.0
80.60
the 2.26.8% range. Organic content has a great
* Samples analyzed by M.E. Walsh at CRREL using
impact on drying times of the sediments and sorp-
SPME and GC.
tion of colloidal white phosphorus. No organic
† Sample bag broke on extraction from basin.
16


 Previous Page
