1.0
changes in linear velocity (Fig. 1). We sys-
tematically changed the linear velocity to
RDX
document this effect.
HMX
0.8
Van Deemter curves indicate that opti-
mum linear velocity for peak resolution is
0.6
26 cm/s when using hydrogen carrier gas
and a 0.53-mm-i.d. column. When using
direct injections, the manufacturer of the
0.4
inlet liners recommends using twice the
optimum linear velocity to prevent tailing
of the solvent front and sharpen early elut-
0.2
ing peaks. We tested the effect of increasing
carrier gas linear velocity over the range 30
to 185 cm/s and found a significant in-
0.0
0
20
40
60
80
100
120
140
160
180
200
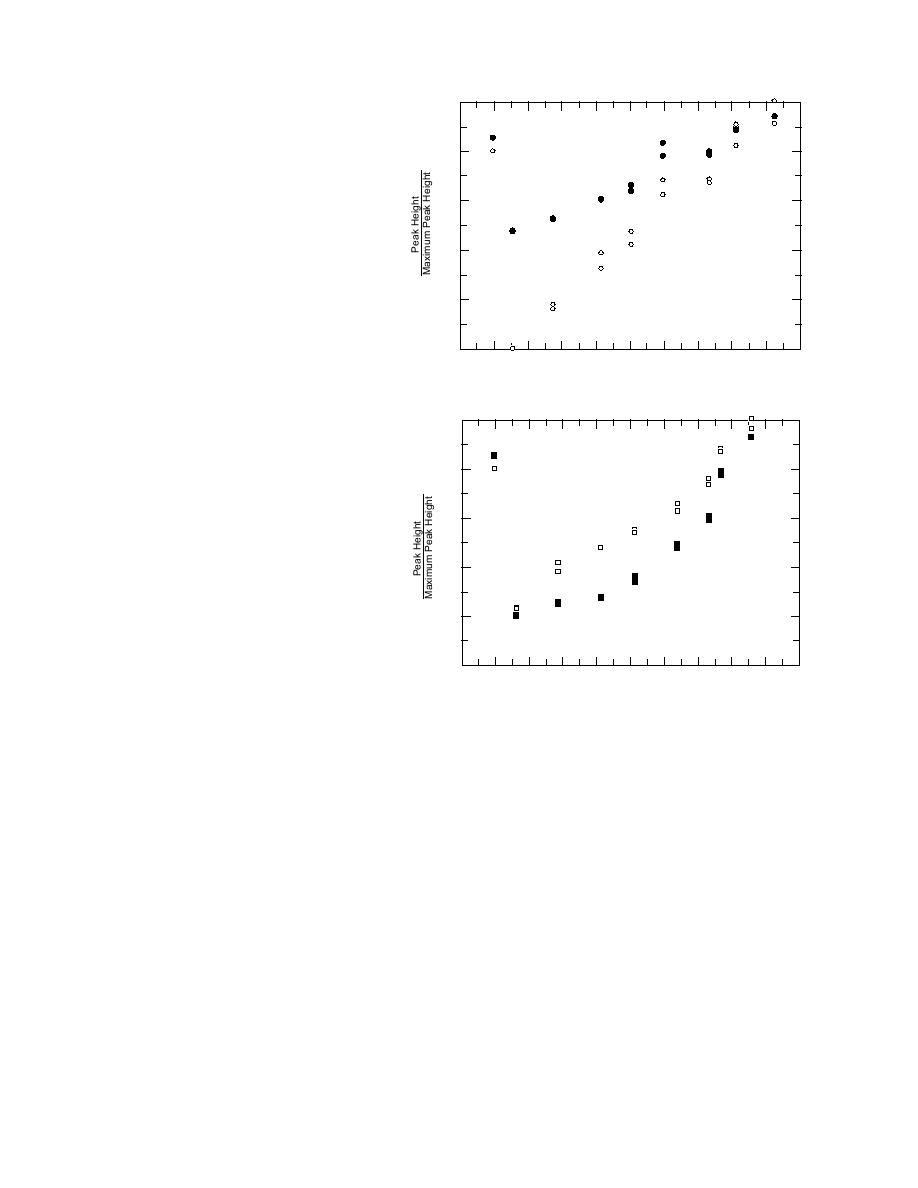
crease in response from HMX, RDX, NG,
Carrier Gas Linear Velocity (cm/s)
and PETN (Fig. 3a, b). For example, no
a. RDX and HMX.
peak was observed for HMX at the lowest
linear velocity tested. The linear velocity
1.0
was increased to 55 cm/s and HMX eluted
as a sharp peak. Thereafter, the HMX peak
NG
PETN
0.8
height approximately doubled with each
doubling of the linear velocity (Fig. 3).
Some degradation in peak resolution did
0.6
occur. Peak widths of the late eluters in-
creased with increasing carrier gas linear
velocity, and the peak for dinitroaniline
0.4
merged with the peak for 4-amino-DNT.
Thus a mid-range carrier gas velocity
0.2
would be appropriate for most analyses.
The calibration factors for 50-g/L solu-
tions of all the analytes were determined at
0.0
three carrier gas velocities (Table 6). The
0
20
60
80
100
120
140
160
180
200
40
Carrier Gas Linear Velocity (cm/s)
were two to three times greater at the high-
b. NG and PETN.
est linear velocity compared with the low-
Figure 3. Effect of carrier gas linear velocity on peak height.
est linear velocity. Also, the response of the
ECD varies considerably from analyte to
and DNA. We found that maximum GC response
analyte. For the nitrotoluenes, the calibration fac-
was obtained at different temperatures for the
tor for TNT was more than 10 times greater than
different analytes (Table 7). In general, the lowest
those for the mono-nitrotoluenes. This variability
temperatures tested (200 to 220C) resulted in the
in relative response needs to be considered when
highest response for the nitrotoluenes and nitrate
preparing calibration standards and in setting ex-
esters. Higher temperatures (250 to 270C) were
pectations for detection limits.
best for the HMX, RDX, the amino-DNTs, and
DNA. However, the effect of injection-port tem-
Effect of injection-port temperature
perature was minor for most of the analytes. Only
Hable et al. (1991) found increased HMX
HMX, NG, and PETN showed somewhat consis-
response with increasing injection-port tempera-
tent trends. An injection-port temperature of
ture, and recommended an injection-port tem-
250C would be suitable for most analyses.
perature of 270C for the determination of TNT,
DNTs, RDX, and HMX. High injection-port tem-
Calibration
peratures were needed to volatilize the nitra-
Traditional ECDs typically have a narrow lin-
mines. We reexamined the effect of injection-port
ear range (approximately fortyfold), with a
temperature at high linear carrier gas velocity
dynamic range of about a thousandfold (McNair
(133 cm/s) for the 8330 analytes plus NG, PETN,
8


 Previous Page
