6000
RTX-200
5000
LV = 40 cm/s
4000
3000
2000
1000
0
0
4
8
12
16
20
24
28
32
Time (minutes)
a. Oven 100C for 1.2 min, 5C/min to 140C, 1C/min to 160C,
20C/min to 250C, hold. Injector 250C. Detector 290C.
15000
RTX-200
LV = 122 cm/s
10000
5000
0
0
1
2
3
4
5
6
7
8
Time (minutes)
b. Oven 150C for 1 min, 20C/min to 250C, hold. Injector 270C.
Detector 290C.
10000
RTX-225
LV = 108 cm/s
8000
6000
4000
2000
0
0
2
4
6
8
10
12
14
16
Time (minutes)
c. Oven 100C for 2 min, 10C/min to 220C, hold for 8 min. Injector
220C (column maximum). Detector 250C.
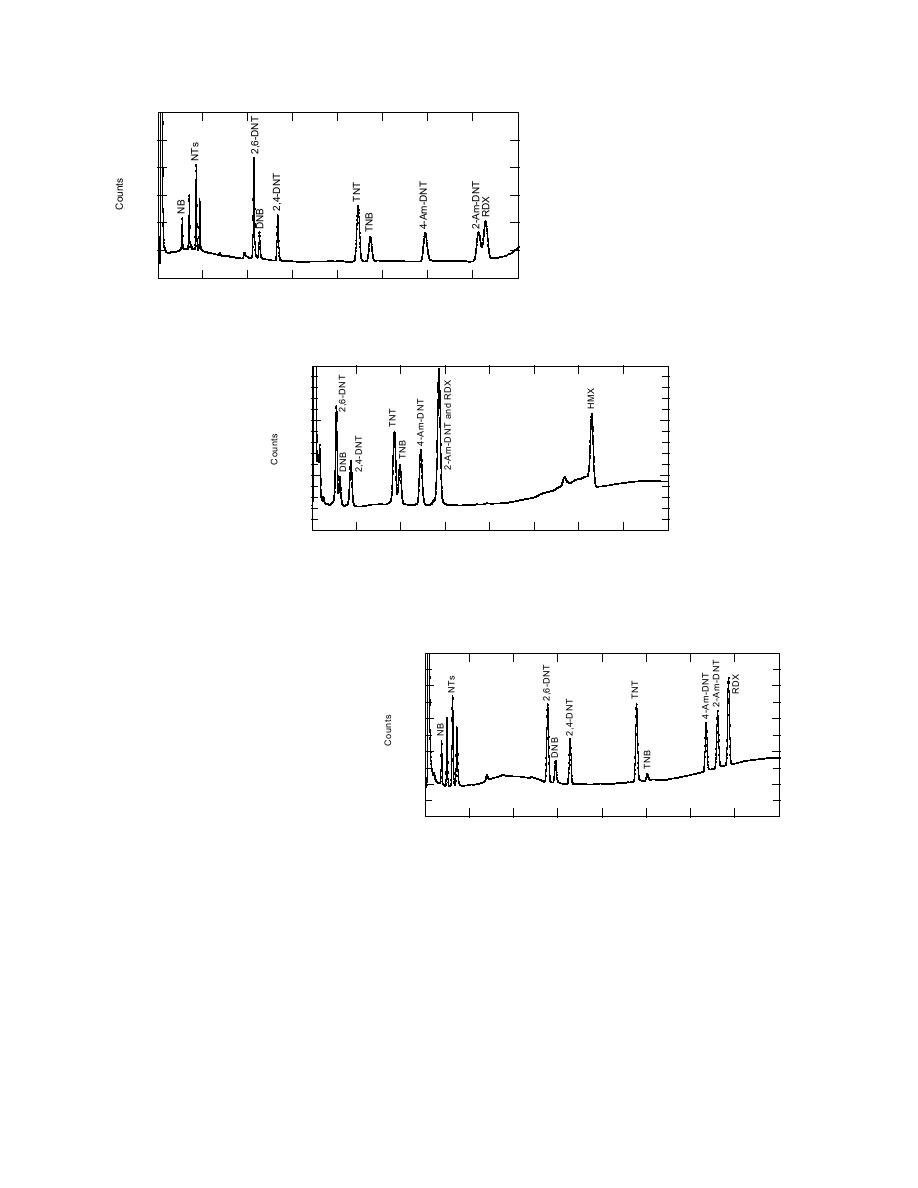
Figure 2. Chromatograms obtained on confirmation columns. DNB, 2,6-DNT, 2,4-DNT, TNB, TNT, 4-Am-DNT, 2-
Am-DNT at 50 g/L, RDX at 100 g/L, and NB, o-NT, p-NT, m-NT, and HMX at 500 g/L.
elutes after the amino-DNTs whereas it elutes be-
of the amino-DNTs. Thus, for confirmation, ex-
fore the amino-DNTs on the DB1 (Table 5).
tracts must be analyzed under the appropriate
conditions. Both the RTX-200 and RTX-225 look
Effect of carrier gas linear velocity
promising for confirmation because the elution
While testing various temperature programs
order of several analytes is the reverse of that on
and carrier gas linear velocities, we noticed that
the DB1. For example, 2,6-DNT and DNB reverse
the HMX peak height changed significantly with
order, as do TNT and TNB. In addition, RDX
7


 Previous Page
