Ratio of No. Desiring to No. Currently Monitoring
0.4
0.8
1.2
1.6
Ice Thickness
Water Temperature
Air Temperature
Discharge
Water Stage
Ice Areal Coverage
Ice Concentration
Ice Movement
Date of Ice In
Date of Ice Out
Freezeup Stage
Condition of Ice
0
20
40
60
80
Number of Positive Responses
Desire Capability
Currently Monitor
Ratio Desire to Currently Monitor
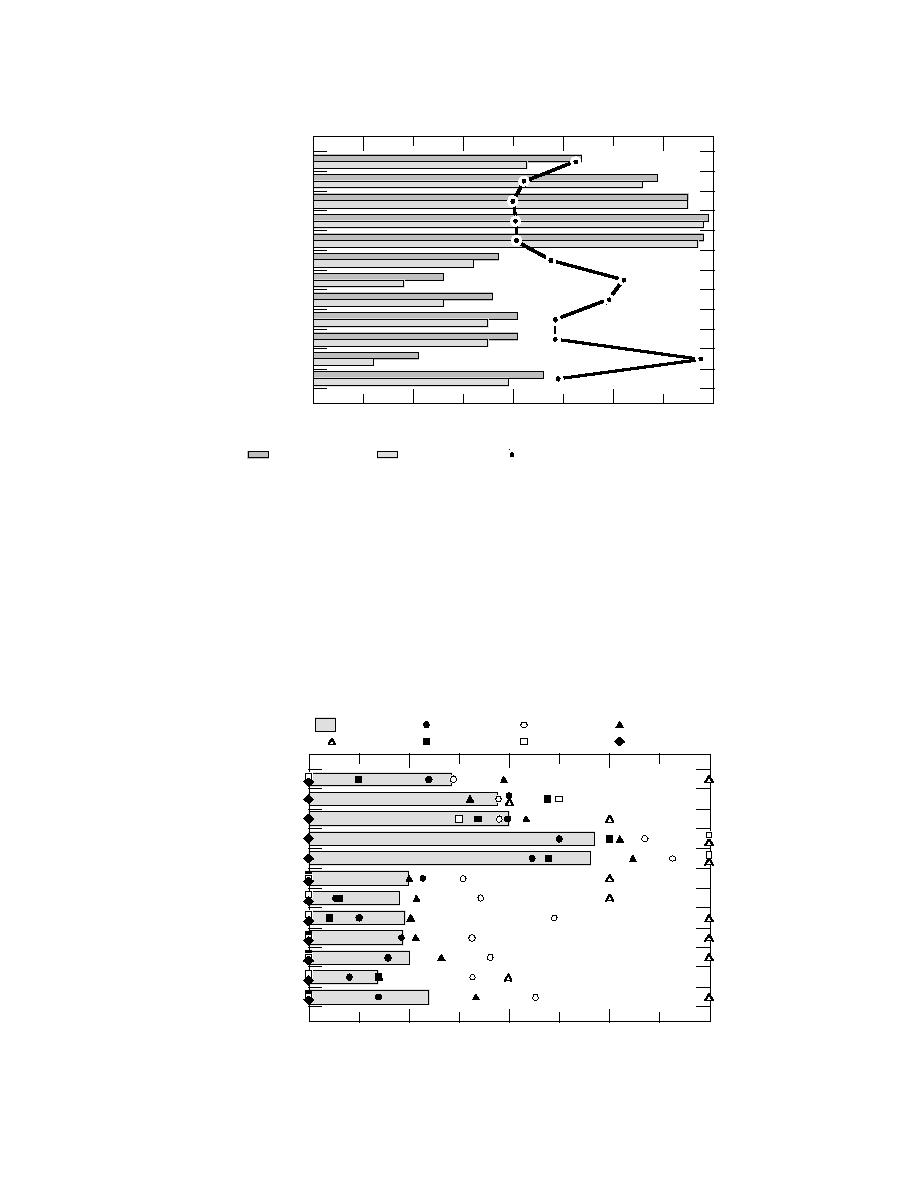
Figure 3. Number of respondents desiring monitoring capability not currently monitoring.
of information from a choice of 10 methods and
temperature can be, and often are, monitored re-
sources. A space was provided to write in any ad-
motely, while ice thickness and condition of ice
ditional method or source used but not listed. Five
are not typically monitored remotely, indicating a
of the choices presented dealt with the location
need for further research.
from which data are collected or conditions are
monitored (i.e., from shore, structure, motor ve-
Data collection methods and sources
hicle, boat, aircraft, or ice surface). Two choices
In the question dealing with data collection
dealt with remote data collection methods (data
methodology, respondents were asked to identify
collection platforms [DCPs] and satellites). Three
currently used data collection methods or sources
Average
Missouri River
North Atlantic
North Central
New England
North Pacific
South Pacific
South Western
Ice Thickness
Water Temperature
Air Temperature
Discharge
Water Stage
Ice Areal Coverage
Ice Concentration
Ice Movement
Date of Ice In
Date of Ice Out
Freezeup Stage
Condition of Ice
1
2
3
4
5
Rating: Low (1) to High (5)
Figure 4. Rating of ice parameter monitoring importance, overall and by Division (as of 1995).
6


 Previous Page
