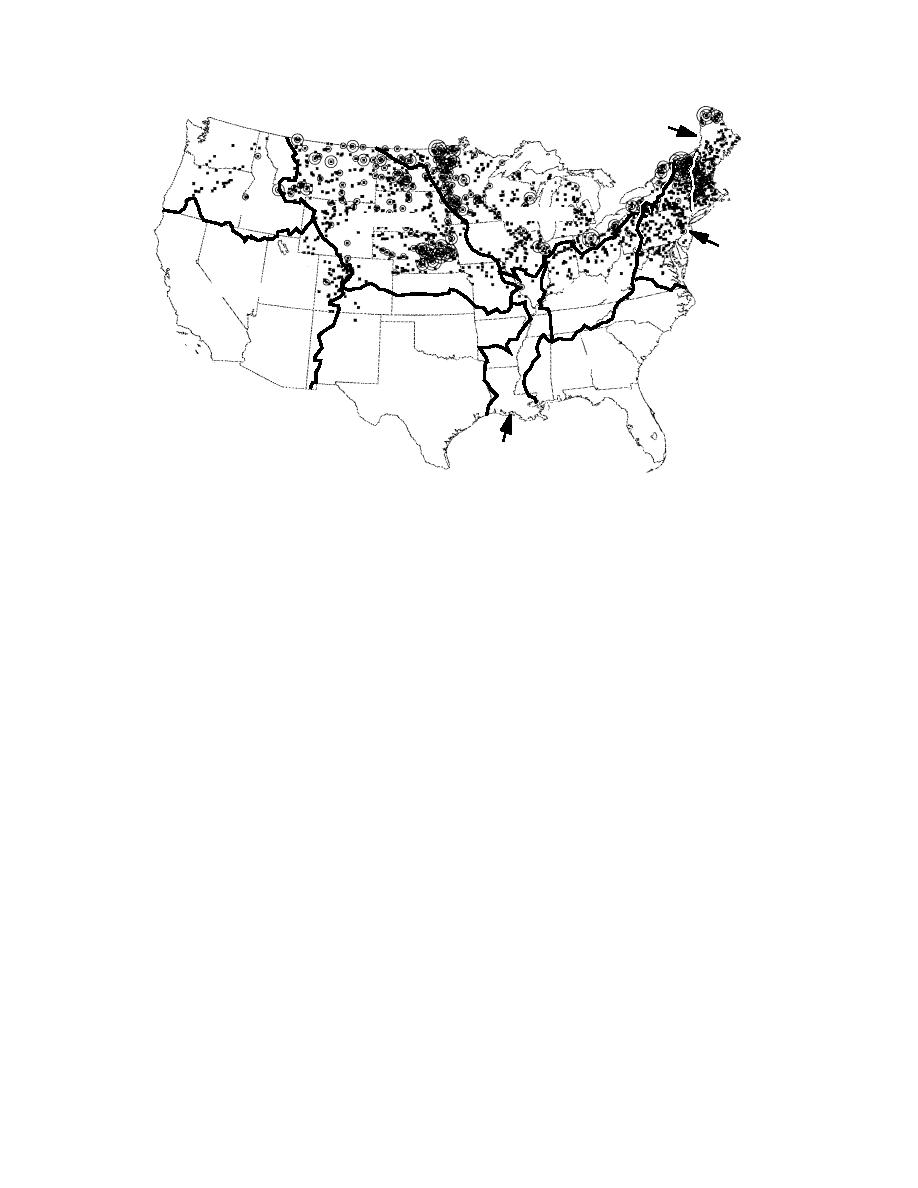
New England
North Pacific
North Central
Missouri River
North
Atlantic
South Pacific
Ohio River
South Atlantic
Southwestern
Lower Mississippi Valley
Figure 1. Map of USACE Divisions susceptible to ice problems in the continental U.S. Each square represents one
to nine ice events, and each circle represents an additional one to nine events.
through entries in the CRREL Ice Jam Database
SURVEY OF PRESENT METHODS
(White 1996), or through a review of the HEC Res-
A survey designed to identify existing and de-
ervoir Database (HEC 1994). Nearly 100 responses
sired ice data collection methods and instrumen-
were received; Table 1 identifies the responding
tation at USACE Districts was prepared by Omaha
Districts, their acronyms, and the number of sur-
District personnel in conjunction with IERD re-
vey responses from each. Table 1 also contains the
estimated number of USACE projects in ice-af-
search engineers (Fig. 2). The main purpose of the
fected areas. These projects (reservoirs, locks, and
survey was to determine where future efforts in
dams) were identified by comparing ice-affected
instrumentation and in data storage, display and
hydrologic unit boundary areas identified in the
retrieval may be most beneficial to the greatest
CRREL Ice Jam Database with the locations of
number of users. The survey had three main query
areas, each with several questions. Part 1 dealt with
USACE projects in the HEC Reservoir Database.
data collection: which ice parameters are being
Districts without these types of USACE projects
monitored, their relative importance to users, and
(e.g., Sacramento District) may be involved in
how data are currently being collected. Part 2 dealt
emergency response to ice jam flooding or may
with the frequency of ice impacts to structures and
have riverine structures, such as levees, that are
operations and the timing of ice impacts. Part 3
ice affected, and thus would also have a need for
ice monitoring.
dealt with methods and format for data storage
The number of surveys returned by each Dis-
and retrieval. Data from the surveys were tabu-
trict corresponds relatively well to the number of
lated in a database for querying and evaluation. A
projects in ice-affected areas. However, several
literature review was also conducted to investi-
Districts had a low number of responses relative
gate existing ice data collection methods and new
uses for other types of instrumentation.
to the number of potentially ice-affected projects
during part of the winter season, particularly
Huntington (ORH), Louisville (ORL), Pittsburgh
Survey results
The survey was sent to the 24 Districts in eight
(ORP), and Rock Island (NCR) Districts, and New
divisions and one Division that is not divided into
England Division (NED). The low response rate
Districts. These were identified by IERD as hav-
from these four Districts may slightly skew sur-
ing at least occasional river ice problems, either
vey results away from navigation-related ice moni-
2


 Previous Page
