0.03
0.6
Fall
Winter
Spring
Summer
Fall
Winter
Spring
Summer
0.02
0.4
0.01
0.2
0
0
1970
1975
1980
1985
1990
1970
1975
1980
1985
1990
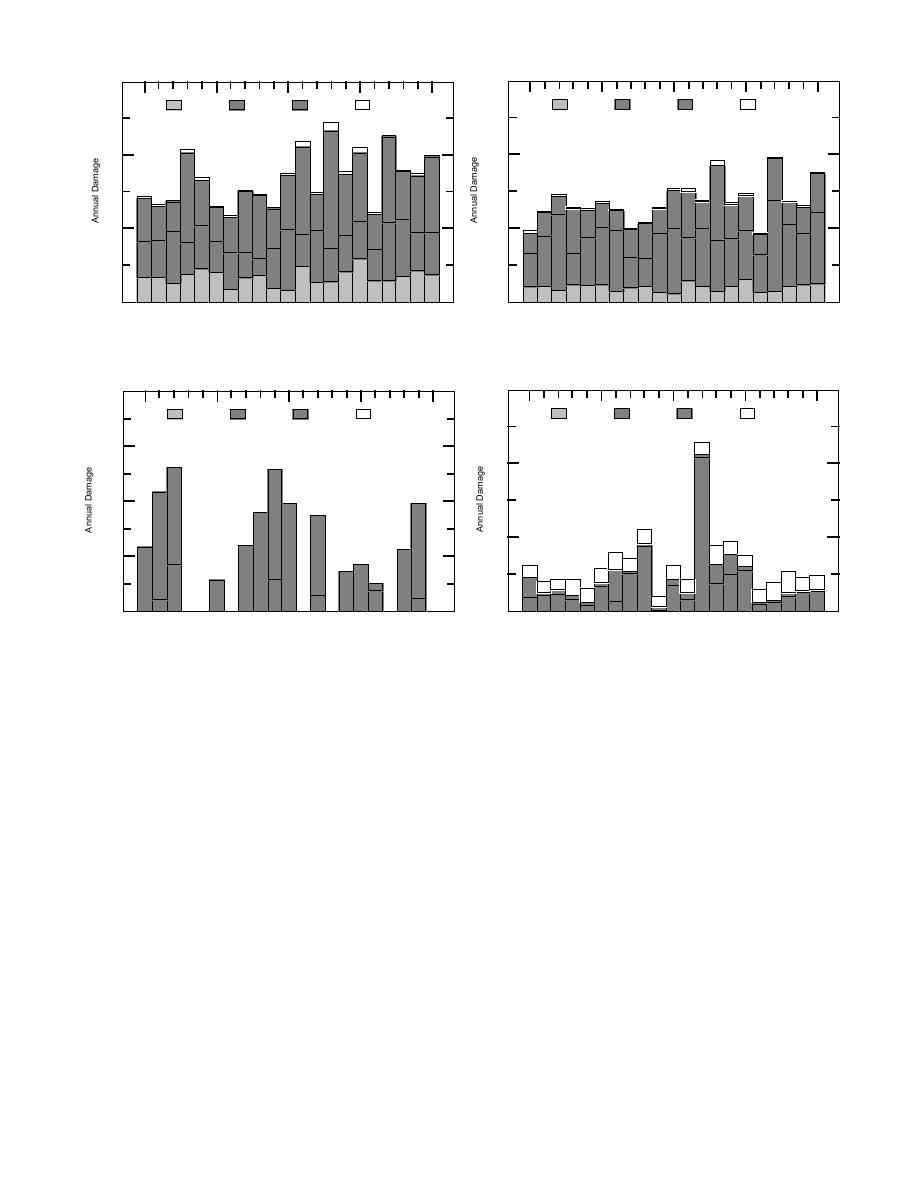
a. Conventional section, Asphalt Institute horizontal
c. Full-depth section, Asphalt Institute horizontal strain
strain model MS-11.
model MS-11.
0.6
0.04
Fall
Winter
Spring
Summer
Fall
Winter
Spring
Summer
0.03
0.4
0.02
0.2
0.01
0
0
1970
1975
1980
1985
1990
1970
1975
1980
1985
1990
b. Conventional section, Asphalt Institute vertical strain d. Full-depth section, Asphalt Institute vertical strain
model MS-1.
model MS-1.
Figure 30. Distribution of cumulative damage during seasons.
amounts in the summer. In the full-depth cross
from Mn/ROAD was not accomplished due to
section, horizontal strain damage occurred prima-
delayed completion of the road.
rily in the winter, with slightly less in the spring,
The Phase 1 modeling series indicated signifi-
and some additional damage in the fall. Both ver-
cantly different performance by the different test
tical strain models predicted damage in the full-
sections and highly variable results depending on
depth section to occur mainly in the winter, with
the performance model applied (Table 15). The
some in the spring. The Asphalt Institute vertical
simulated performance of the test sections was
strain model also predicted additional amounts of
also significantly affected by the subgrade condi-
summer damage.
tions, e.g., density, soil moisture and water table
depth. For example, compare the model predic-
tions using the Asphalt Institute MS-1 horizontal
DISCUSSION AND
strain criteria. For case f4w6, the full-depth 5-yr
RECOMMENDATIONS
section with the 1206 subgrade in its high density
condition, the model predicts 28,585,000 applica-
The component of this study involving verifi-
tions to failure. In case f4w6ld, the same test
cation of the Mechanistic Pavement Design Pro-
section with a low density value for the 1206
cedure results with pavement performance data
subgrade, the model predicts 1,905,000 applica-
42


 Previous Page
