0
0
a
AC
100
40
Subgrade
200
80
300
120
107
7 107
b
6
6
7 10
10
Asphalt
105
7 105
Subgrade
104
7 104
103
7 103
0.04
1.0
c
0.03
CEV
CEH
0.02
0.5
0.01
AIH
0
0
100
200
300
Elapsed Time (days)
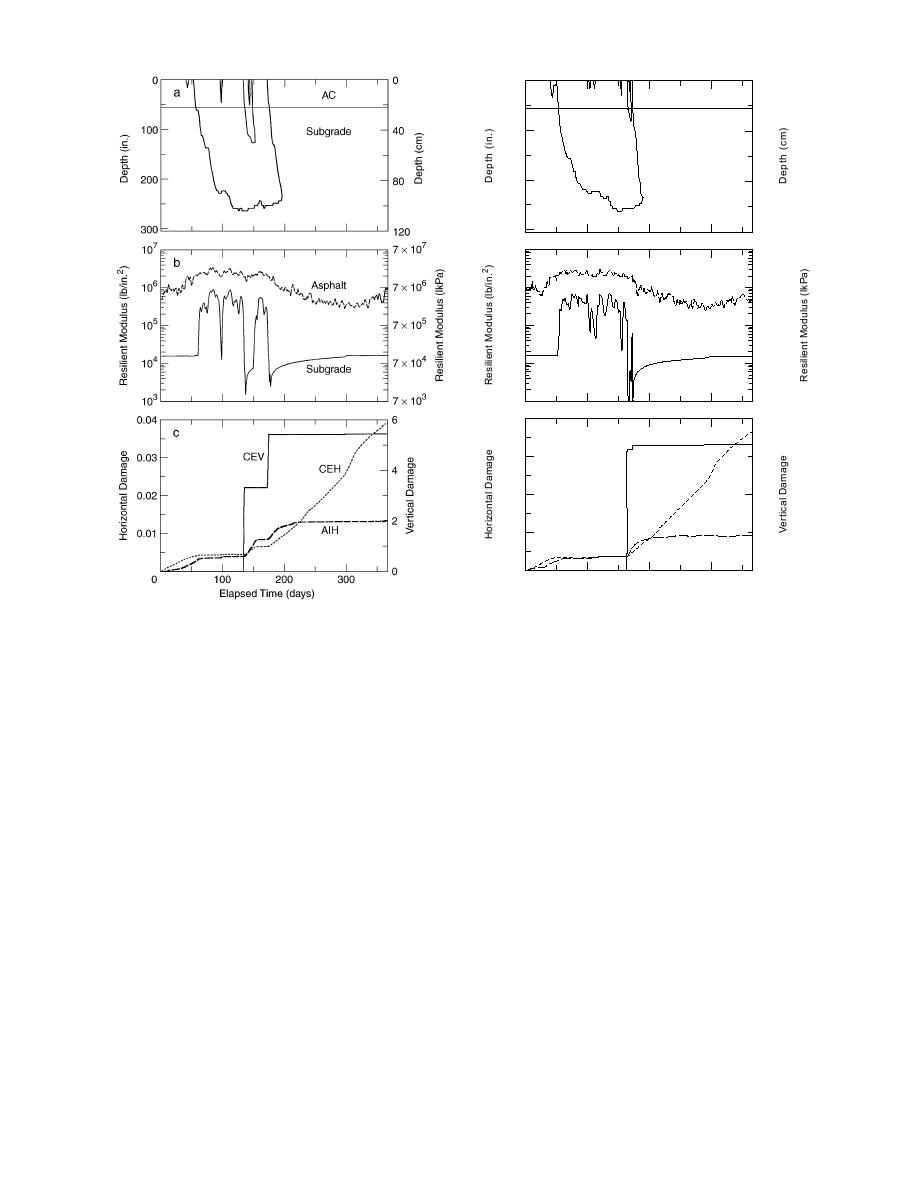
Figure 28. Predicted results from simulation of
Figure 29. Predicted results from simulation of
full-depth section during freeze season 19831984,
full-depth section during freeze season 19851986,
starting on 1 October; a) frost/thaw depth, b) seed
starting on 1 October; a) frost/thaw depth, b) seed
resilient modulus passed to NELAPAV, and c) cu-
resilient modulus passed to NELAPAV, and c) cu-
mulative damage (see Table 19).
mulative damage (see Table 19).
enter the subgrade and the maximum depth of
in the middle of the 19831984 freeze season was
frost penetration beneath the top of the subgrade
accompanied by severe weakening of the subgrade
(Table 19). Lower amounts of damage (higher ap-
both during midwinter and spring thaw, which re-
plications to failure) were predicted by the As-
sulted in a considerable amount of predicted dam-
phalt Institute horizontal strain model in seasons
age (Fig. 28). The 198586 year experienced a
with higher freezing indices and deeper frost pen-
nearly continuous freeze season with no signifi-
etration in both the full-depth and conventional
cant midwinter thaw event (Fig. 29). As a result,
cross sections. However, predictions of damage
the subgrade modulus underwent thaw weakening
from the other models did not correlate with any
only during spring thaw in the 198586 season,
of the above parameters.
and the corresponding total damage accumulation
It was noted that two similarly categorized sea-
was much less.
sons, 198384 and 198586, which had nearly
Based on the above observation, we tried a new
identical freezing indexes and water table depths,
approach to quantifying the characteristics of the
as well as the same number of freeze thaw events,
freeze seasons. It involved summing the thawing
had diversely different damage predictions in the
degree days experienced during the freeze season
full-depth section (Table 19a). A large thaw event
in two ways. The first was a total from all events,
40


 Previous Page
