(ft)
(m)
6
1.8
1.6
5
1.4
4
1.2
1.0
3
3000 (F-days)
0
1000
2000
1600 (C-days)
0
400
800
1200
Freezing Index
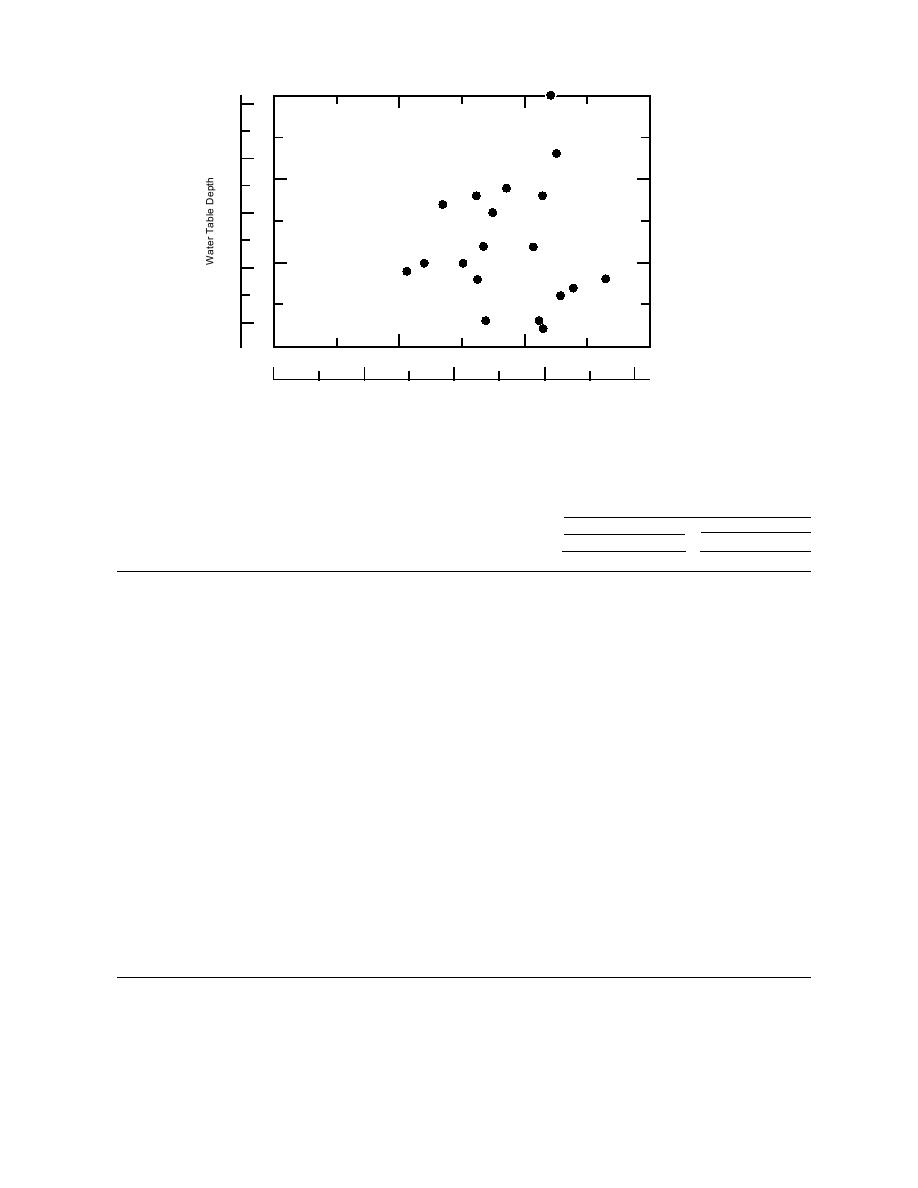
Figure 27. Distribution of freezing indices and water table depths in 21-yr
Phase 3 series.
Table 19. Results of 21-yr freezing index/water table series.
Maximum
Applications to failure (millions)
Water table
Freezing Freeze/thaw freeze depth
Horizontal strain
Vertical strain
depth
index
events in
into subgrade
Asphalt cracking
Subgrade rutting
C (F) -days subgrade
Year
m (ft)
(cm)
CEH
AIH-MS11 CEV
AIV-MS1
A. Full depth (F4)
6970
1.5 (4.8)
1191 (2144)
2
91.8
18.20
66.00
0.21
5.38
7071
1.3 (4.2)
1152 (2074)
4
91.8
18.02
52.59
0.34
8.23
7172
1.1 (3.6)
1274 (2294)
2
91.8
15.16
45.02
0.31
7.64
7273
1.2 (4.0)
839 (1510)
2
69.8
18.97
50.69
0.37
7.72
7374
1.3 (4.2)
923 (1661)
2
77.8
17.80
51.48
0.78
10.97
7475
1.4 (4.6)
968 (1743)
3
81.8
17.21
47.93
0.18
5.47
7576
1.3 (4.2)
931 (1675)
3
73.8
16.83
52.26
0.16
4.15
7677
1.6 (5.3)
1256 (2261)
4
107.8
17.92
62.38
0.16
4.87
7778
1.1 (3.7)
1331 (2395)
1
91.8
13.88
60.22
0.10
3.01
7879
1.2 (3.8)
1477 (2658)
3
99.8
17.66
51.36
6.66
17.18
7980
1.2 (3.8)
903 (1625)
5
79.8
16.67
43.10
0.19
5.30
8081
1.2 (4.0)
666 (1199)
3
67.8
17.15
42.63
0.26
7.72
8182
1.8 (6.0)
1227 (2209)
3
107.8
16.29
47.92
0.04
1.44
8283
1.2 (3.9)
589 (1061)
8
63.8
16.73
34.26
0.11
3.71
8384
1.0 (3.3)
1179 (2123)
2
81.8
16.86
48.96
0.12
3.50
8485
1.0 (3.3)
942 (1696)
3
81.8
16.08
44.68
0.15
4.31
8586
1.0 (3.2)
1197 (2154)
2
81.8
17.67
71.27
0.79
11.48
8687
0.9 (3.0)
467 (841)
4
45.8
15.91
33.52
0.48
8.44
8788
1.5 (4.8)
898 (1616)
4
87.8
16.91
48.28
0.34
6.15
8889
1.5 (4.9)
1032 (1858)
4
87.8
17.57
50.53
0.26
7.19
8990
1.4 (4.7)
750 (1350)
7
65.8
16.50
37.45
0.25
6.83
Notes:
CEH = Corps of Engineers (horizontal)
CEV = Corps of Engineers (vertical)
AIH-MS11 = Asphalt Institute (MS-11)
AIV = Asphalt Institute (MS-1)
ND = no damage
Traffic simulated at rate of 660,000 ESAL applications/yr.
38


 Previous Page
