distance of headward recession was mea-
sured as the centerline distance within each
gully between known points. The average
Coastal 1
rates were then determined by dividing the
distance of centerline recession by the num-
Coastal 4
ber of years between each measure.
Coastal 7
Bread Truck
Water quality parameters
Coastal 5
Coastal 6
Various types of water quality data have
In-Between Gully
Parachute
been collected at multiple sites to assess the
RB Bravo
t.
Tanker
ridge
surface hydrology and water quality of ERF.
B Gully
The majority of sampling sites were in small
plunge pools at the heads of tidal gullies;
N
River North
three were newly located in ponds in 1995
in some of the most heavily contaminated
Illume Pond
Racine Island
River Meander
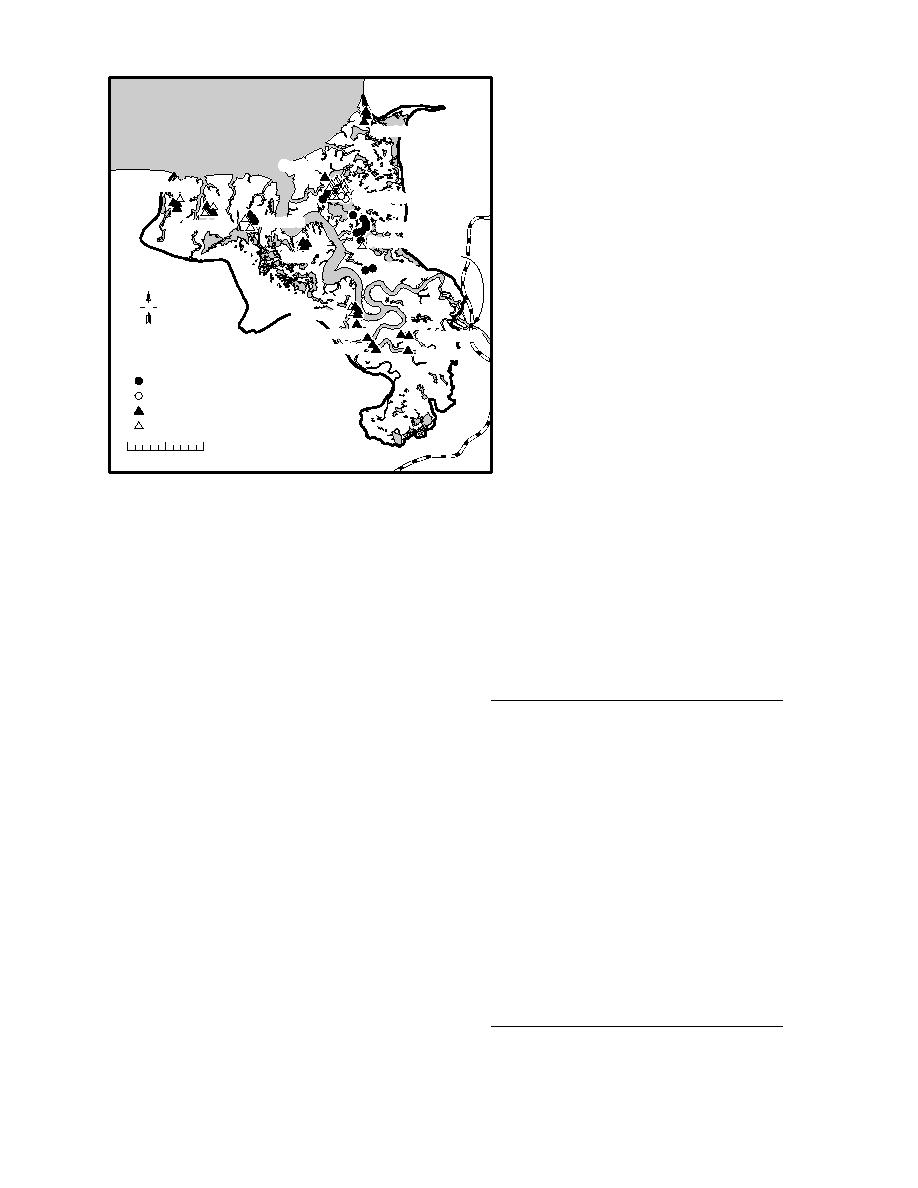
locations of Eagle River Flats (Fig. 17). The
River South
site at Mortar Gully receives tidal waters
1992 Gully Erosion Hub Sites
directly from Knik Arm, whereas Bread
1993 Gully Erosion Hub Sites
Truck, Parachute, B and In-Between gullies
1994 Gully and River Erosion Hub Sites
are located in drainages that flow into the
995 Gully Erosion Hub Sites
Eagle River and therefore have mixed fresh
0
500
1000 m
and tidal water sources. Racine Island Gully
receives most of its water influx from the
Figure 16. Location of gully headwall and lateral wall erosion
Eagle River during the summer. The three
sites.
pond locations where measurements were
recorded--C, A and Racine ponds--are dis-
tributed in the eastern, western and southern sec-
not absolute values based upon each hub to line
tions of ERF. The two remaining sites represent
stake measurement.
the primary source waters: the Eagle River up-
Historical aerial
photographic analyses
During 1995, multiple sets of aerial photographs
Table 5. Historical aerial photography of
were acquired to increase our historical coverage
Eagle River Flats.
of Eagle River Flats (Table 5). Our current aerial
Year
Date
Type
photography archive provides a 45-year record of
surficial changes at ERF from 8 August 1950 to 9
1950
8 August
B/W
1953
27 June
B/W
October 1995. The images are of variable quality
1957
12 July
B/W
and range from the highly blurred 1967 black and
1960
30 August
B/W
white images to the high resolution natural color
1962
17 May
B/W
photographs of 9 October 1995.
1967
Unknown
B/W
1972
July
False color IR
We measured historical changes by studying
1972
9 August
B/W
aerial photographs taken at approximately de-
1974
7 May
B/W
cade intervals (1950, 1960, 1972, 198486 and 1995).
1977
Unknown
False color IR
The actual photography set used was determined
1978
August
False color IR
1984
12 August
False color IR
by our ability to detect gully headwall scarps. The
1986
5 October
True color
headwalls of B-Gully, Parachute Gully, In-Be-
1986
12 September
LANDSAT TM (Digital)
tween Gully, Bread Truck Gully, Mortar Gully
1988
4 August
B/W
and Coastal 5 Gully were mapped to document
1991
21 June
Color IR
1992
22 May
Color IR
their recessional histories.
1992
2 August
Color IR
Average rates of headward recession were cal-
1993
8 July
B/W Orthophotograph
culated by transposing the position of the gully
1994
30 August
Color IR
headwall scarps onto gully base maps produced
1995
16 August
Color IR
1995
9 October
True color
from the 9 October 1995 aerial photographs. The
21


 Previous Page
