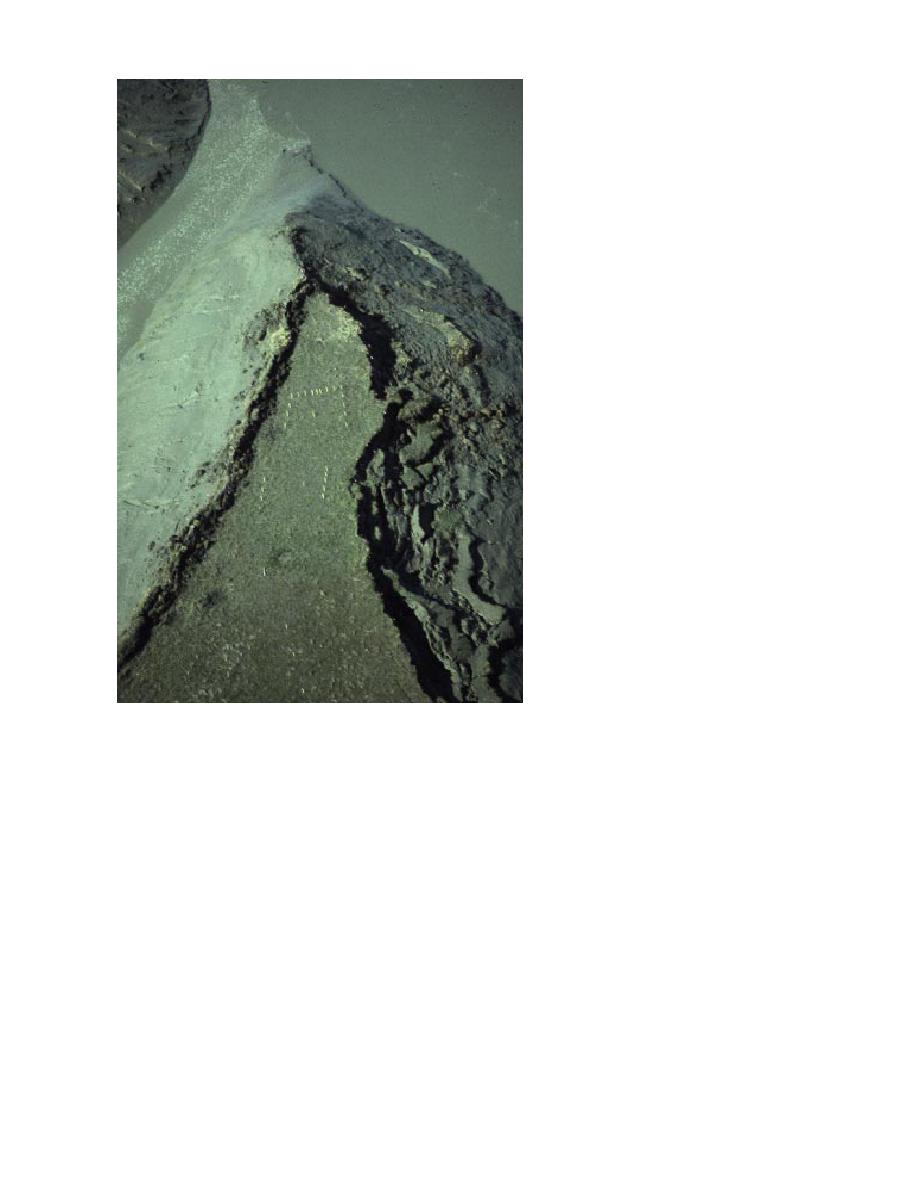
allel to the crest of the gully scarp, and a
"hub" stake was set at a known distance
from this stake line (Fig. 15). The dis-
tance between the hub and the crest of
the gully scarp was measured across the
top of each line stake with a tape mea-
sure. The position of the gully scarp crest
was identified by lowering a plumb bob
on a string from the tape measure, so
that the horizontal distance could be read
where the string and measuring tape
met. Flagged wire stakes were then
placed at each point of measurement
along the headwall. We periodically re-
locate the stakes when scarp recession
takes place (Fig. 16) and either removes
or threatens them. Repeated measure-
ments using this technique allow us to
monitor changes in scarp geometry with
time, as well as the rate of gully reces-
sion.
Recession rates were measured in
September 1992, 1993, 1994 and 1995,
in May 1993, 1994 and 1995, in Novem-
ber 1994 and late October 1995. The
September measurements delineate
summer rates, while those of May or
June delineate winter rates. The October
1995 and November 1994 data show the
amount of erosion since the end of sum-
mer measurements and the initial pe-
riod of freezeup. Repeated measure-
ments at points without any retreat (as
indicated by the continuing presence of
wire flags) indicate that they are repro-
ducible to 25 cm. Their accuracy, how-
Figure 15. Example of layout of hub and line stakes at River-North
ever, is limited by how well the crest of
erosion site.
the gully scarp can be defined, the shape
of which is highly irregular. In the worst
case, accuracy is probably limited to 10 cm.
this plate, but this sediment can also be reworked
and resuspended by wind or other mechanisms,
Recession data are presented as a range of maxi-
thereby delineating a net rate. The thickness of
mum recession rates measured orthogonally to
sediment at three locations was measured to the
the gully or river at each site. This method differs
nearest 0.5 mm using a graduated scale.
from previous years' method, where erosion mea-
surements were reported as collected in the field
and did not account for apparent distances cre-
Gully erosion and
ated by the method (Lawson and Brockett 1993;
headwall recession
Tidal gullies draining ponds and mudflats are
Lawson et al. 1995, 1996). These rates tended to be
actively extending inland by erosion at their heads.
higher than actual wherever hub to line measure-
We established 86 sites between June 1992 and
ments were made at an acute angle to the scarp,
May 1995 to evaluate retreat rates. At each site,
thus recording an oblique distance. Measurements
stakes were driven into the ground along a line at
reported herein were taken from scaled summary
known distances from one another, typically par-
plots and summarize the range in recession rates,
20


 Previous Page
