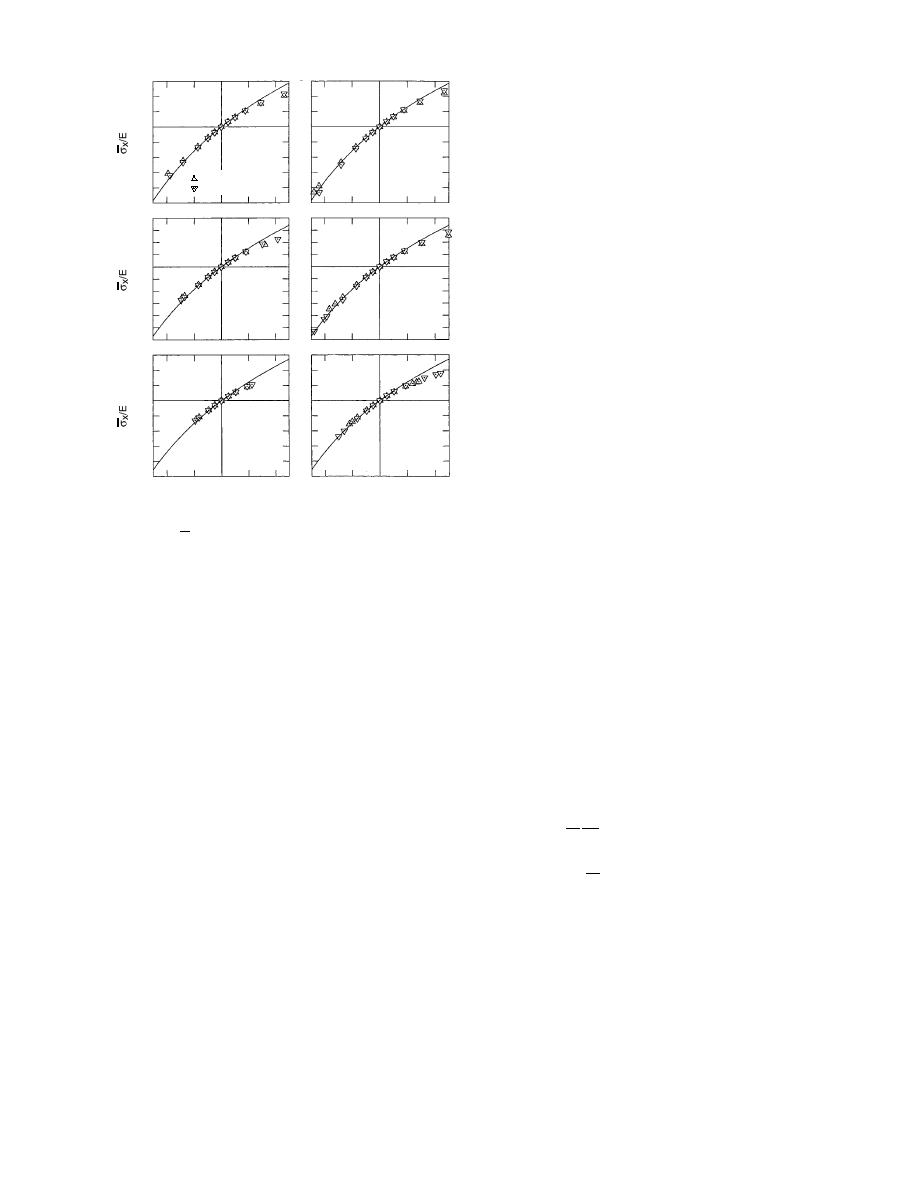
for the respective t = 1 s and t = 1000 s responses
Sealant A
Sealant B
0.2
of sealant A, and E = 330 kPa and E = 170 kPa for
d/w = 0.5
d/w = 0.5
the 1 s and 1000 s responses of sealant B. The
0
analyses were conducted to allow comparison of
predictions of eq 7 with the more realistic nu-
0.2
merical results. The general nonlinearity of the
1 s Response
0.4
1000 s Response
finite element predictions and the effect that the
depth-to-width ratio has on the behavior are in-
0.4
deed captured by the eq 7 approximation. For
Sealant A
Sealant B
d/w = 1
d/w = 1
0.2
compressive strains the differences between the
predictions in Figure 5 are typically less than 10%.
0
For extensive strains, however, the eq 7 relation
0.2
predicts considerably stiffer responses than the
finite element analyses. As indicated in Figure 5,
0.4
the eq 7 predictions are closest to the numerical
0.6
results for the d/w = 0.5 and d/w = 1 seals. In this d/
Sealant A
Sealant B
w range, and for extensions nearing 25%, the com-
0.4
d/w = 2
d/w = 2
parisons indicate that the Payne/Gent and Lindley
0
equation would provide conservative estimates
of the average bond stress that are roughly 20
0.4
30% high.
The small and large deformation relations of
0.8
eq 5 and 7 indicate that butt joint seals with large
0.2 0.1
0
0.2
0.1
0.2 0.1
0
0.1
0.2
e
e
depth-to-width ratios should be avoided. It should
be noted that, for asphalt pavement crack seals,
Figure 5. Ratio of the nominal stress to the Young's
modulus, σx /E, for joint seals with depth-to-width ra-
these relations provide a structural analysis-based
argument for preparing a joint at a crack rather
tios 0.5, 1, and 2, as a function of nominal compression
than simply filling the crack. A hypothetical ex-
and extension strain e (continuous curves). Finite ele-
ment data for silicone sealants A and B at 0C and
ample for an asphalt pavement crack seal design,
illustrating the use of eq 5 and 7, is presented in
relaxation times 1 s and 1000 s (discrete points).
Appendix A.
vided by the elastic modulus E, which is a func-
Stress distributions
tion of the depth-to-width ratio. Predictions for
at bonded interface
Equation 4 gives the normal stress distribution
compressions and extensions up to 0.25 are de-
at the interfaces between the seal and the joint for
picted. In the latter figure, predictions are shown
small deformations. The corresponding tangen-
for three depth-to-width ratios: 2, 1, and 0.5. The
tial stress distribution ty (y) is found, as suggested
curves in both figures demonstrate the nonlinear
stressstrain response predicted by the Payne/
by Gent et al. (1974), from the pressure distribu-
Gent and Lindley expression, and the curves in
tion p(y) according to
Figure 5 further demonstrate the effect of increas-
wp
ty (y) =
ing d/w values on the average bond stress acting
2 y
on a seal.
Figure 5 also includes results from large defor-
(8)
y
= -2
Ee .
mation numerical analyses of butt joint seals.
w
These analyses were finite element analyses, us-
Expressions like eq 4 and 8 for bonded rubber
ing the commercially available software ABAQUS
cylinders have been derived and validated by
(Hibbitt, Karlsson, and Sorenson, Inc. 1993), that
experiment by Gent et al. (1974).
incorporated strain energy constitutive models of
two silicone sealants at 0C for 1 s and 1000 s
The normal and tangential stress distributions
are illustrated in Figure 6 for the d/w values 4, 2, 1,
relaxation times (Ketcham et al. 1996). The seal-
and 0.5. The stresses, per unit nominal strain, are
ants are designated "sealant A" and "sealant B"
shown in a nondimensional form divided by the
in Figure 5. The measured Young's moduli of the
sealants at 0C were E = 540 kPa and E = 350 kPa
elastic modulus E as a function of the position y/d
5


 Previous Page
