jor island groups while leading a cargo ship. It too
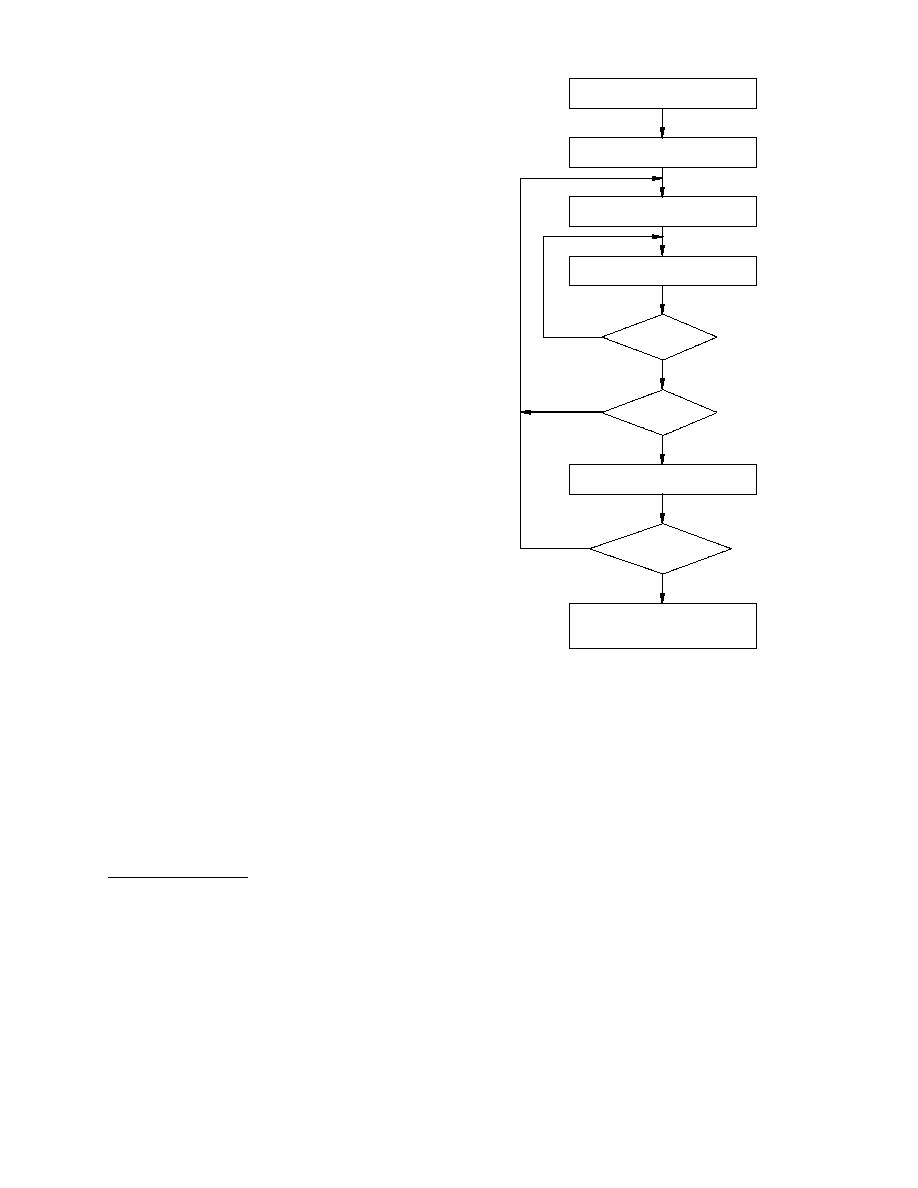
a. Read input arguments
from command line.
reached the Pole in 1987, becoming the second sur-
face vessel ever to do so. During the summer of
1990, the Rossiya, built in 1985, accomplished the
b. Read environmental data
first commercial cruise to the North Pole, with 88
and node data from disk.
tourists from 12 countries aboard. In 1991, the 2-
year-old Sovietskiy Soyuz repeated the commercial
c. Chart course
cruise with 80 more tourists from 15 countries on
to next data point.
board. The very next year, this same ship became
the first to reach the Pole twice in one summer, as
this type of commercial venturing grew in popu-
d. Calculate speed based on
new environment: sail for 8 hours.
larity. The Yamal, built in 1992, had reached the
Pole six times by August of 1994.* A sixth ship,
the Ural, was scheduled to be commissioned in
At next
No
1995 but was delayed due to economic conditions.
point/node?
All six ships list their home port as Murmansk.
Yes
These ships are uniquely equipped for escort
duty through ice conditions that thwart any other
No
At end
icebreaker. The Arktika-class icebreaker has three
of voyage?
5.7-m-diameter screws that can power the ship at
22 kn through open water. Special ice navigation
Yes
features include a low-friction hull coating, water-
e. Calculate summary statistics
and air-jetting systems, and heeling tanks. The
for voyage just completed.
outer hull is 4.8 cm thick where it meets ice and 2.5
cm elsewhere. At its strongest point, the steel prow
is 50 cm thick. The ship can break ice in both for-
At end of
No
ward and reverse directions. Its dimensions are
transit simulation?
150 m loa, 30 m beam, 11.1 m draft, and 23,460 t
displacement. It is a multipurpose icebreaker with
Yes
some cargo capacity and four deck cranes, two of
f. Calculate statistics
which have a 16-t lift capacity. It does require a
summarizing the
completed simulation.
large crew of 145, and articles have appeared re-
cently mentioning its high cost to maintain and
Figure 10. Simplified flowchart of entire
operate.
model.
Logic summary
The flowchart shown in Figure 10 summarizes
lated transit is based on (step a). Next, the data
the logic used in the model. The program first reads
files containing the required probability density
the user-supplied command line arguments that
functions are loaded into the program's working
inputs the parameters of ship class, transit direc-
arrays (step b). The program then initializes the
tion, month of transit, level of detail desired in the
ship's position at the origin and selects the first leg
printed output, and number of voyages the simu-
of the voyage (step c). Using the MC method, the
environmental conditions are established for de-
termining the ship's speed for the next 8 hours or
until the next data node is reached (step d). Based
* Capt. L.W. Brigham of the U.S. Coast Guard com-
on ship speed and sailing time, the ship's position
manded the first U.S. surface ship, the Polar Sea, and
is updated along the transit path and checked to
accompanied the first Canadian ship, the Louis St.-
determine whether the next data point has been
Laurent, in reaching the North Pole on 22 August 1994.
reached. At the end of that time or distance seg-
By chance, the Yamal had arrived there two days earlier,
ment, the voyage statistics are updated. If the voy-
and the three ships held an impromptu rendezvous on
age is complete, the summary statistics are com-
the 23rd, approximately 20 nm from the Pole. An un-
piled (step e) and either another voyage is begun
precedented social engagement ensued during which
(back to step c) or the final statistics are compiled
the crews exchanged tours of their respective ships
for that transit simulation (step f).
(Brigham 1995).
20


 Previous Page
