Permafrost Depth (m)
Birch Hill
Bedrock Depth (m)
Road
Railroad
Tank Farm
0
200
400 m
ad
13.7
Ro
ill
14.6
14.9
H
h
Truck Fill
20.7
14
irc
16.5
B
Quarry
17.7
Stand
13.1
14.9
22.3
21.6
27.9
>19.5
17.4 13.4
23.8
8.5
25.6
15.2
11.0
17.4
20.7
0
18.3
38.4 >38.4
22.3
14.3
19.5
20.4
20.1
0 0
29.3
21.0
>20.4
26.2
20.4
45.7 46.6
29.6 22.5 23.2
23.2
23.2
19.5
25.9
20.7
18.6
23.5 27.7 32.3
32.9
19.8
27.1
19.2
23.2 26.2
22.3 23.5
>44.5
17.7
0
N
42.7
30.5
23.5
26.2
36.9
>44.8
7.6
38.7
20.4
37.8
31.7
44.8
22.3
22.5
39 42.1 >42.7
23.5 16.8 20.4
39
37.2
27.7
42.7
40.0
19.2
>27.4
40.2
32.9 36.6
36.6
32.6
36.6
35.7
ad
21.6
36.3
Ro
31.7
34.4
26.5
31.7
r
ve
0
31.1
0
Ri
25.0
26.4
18.0 24.7 31.1
14.3 20.7
11.0
School
Che n
14.9
19.2
21.3
20.4
a
R
12.8
15.2 21.3
22.9
22.5
Tr
ai
Shannon Park
no
rG
Subdivision
ate R ad
o
ROLF
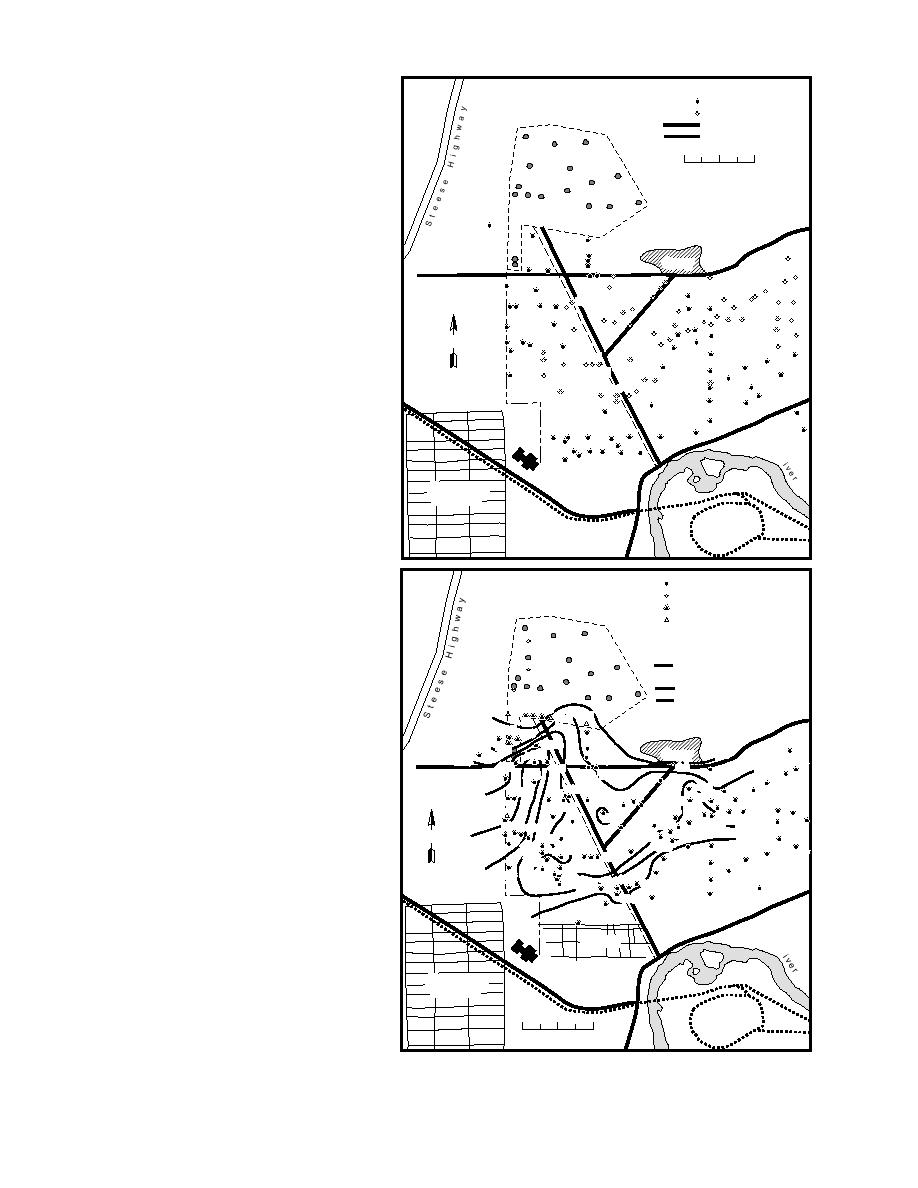
Figure 12. Depths to the bottom of perma-
frost from boreholes in the Canol Road area.
GPR Borehole
Birch Hill
E&E Soil Boring
E&E Monitoring
CRREL Microwell
1.5 Bedrock Depth below Surface
>9.4 Bedrock Depth Greater than
1.5
Tank Farm
Bottom of Drill Hole
Contour
1.5
7.6 Contour Interval (m)
Road
3.4
Railroad
5.8 7.3 5.5
7.6 4.6
ad
>8.2 >9.4
Ro
ill
hH
16.5
14.0
14.0
ir c
14.8
20.7
B
30.2
15.2
13.1
14.0
21.0
Quarry
7.6
>39.9
14.8
22.8
22.3
32.0
8.4
21.6
30.5
17.3 13.4
40.5
8.5
>25.9
23.8
20.6
>20.1
20.4 21.8
60.0
>31.4
26.4
20.1
17.4
30.4
27.7 16.2 26.2 19.5
20.3
>31.4
45.7 47.2
21.6 23.2
22.0 19.5
37.2
32.3
23.0
23.1
27.7
>32.9
19.2
23.2
27.1
>39.6 >39.6
43.9
25.7
17.6
>44.5
19.0
25.0
N
26.1
38.1
>30.5
23.5
16.2
>44.8
30.8
22.6
38.6
>33.5
23.5 16.7
>39.6
46.0
>45.7
23.5
19.5
>42.7
22.1
>44.5 >39.6
19.2 20.4
>43.3
>29.3 21.8
38.1
40.2
>41.1
23.2 21.3
36.6 36.2 36.5
>47.9
>35.1
>33.5
24.1
34.3
d
>45.7
>51.8
a
Ro
34.3
43.3
r
125
ve
Ri
School
Che n
Test Grid
a
R
Tr
ai
Shannon Park
no
rG
Subdivision
ate R ad
o
Figure 13. Preliminary map of the depth to
ROLF
bedrock from borehole data in the Canol
0
200
400 m
Road area; contour interval is 1.5 m.
13


 Previous Page
