30
1992
1994
20
10
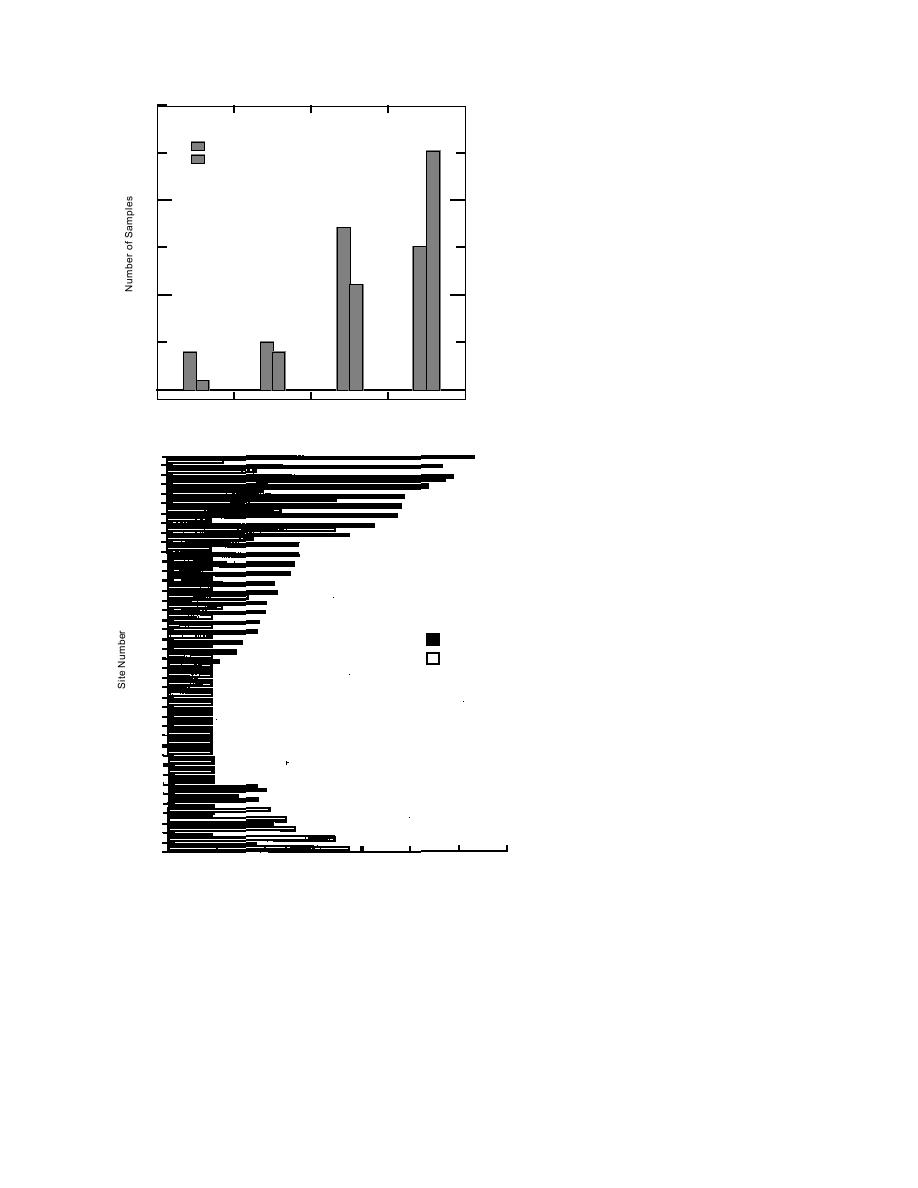
Figure 35. Number of samples in different concentra-
0
tion ranges in 1992 and 1994.
> 10
0.1-9.9
0.001-0.099
< 0.001
White Phosphorus Concentration (g/g)
883
972
977
22 Decrease
982
974
998
997
1001
1005
1002
1992
1006
1994
975
984
988
12 Below Detection Limit
990
Figure 36. Comparison of WP concentrations found in 1992
995
and 1994 around site 883, an intermittent ponded site in
1007
Area C.
976
980
7 Increase
1003
978
0.0001
0.001
0.01
0.1
1.0
10
100
1000
WP Concentration (g/g)
that contained white phosphorus, was exploded
nity for monitoring the persistence of white phos-
on 20 May 1992. The UXO was exploded for the
phorus in an intermittent pond. The elevation of
safety of researchers. Since the shell of this UXO
the rim of the crater is 4.77 m, while the center is
was extremely corroded, the filler material was
only 4.45 m. Because of this elevation difference,
not identified as white phosphorus until a dense
the rim is subaerially exposed for longer periods of
white cloud formed when the round detonated
time than the center. The initial white phosphorus
concentrations in the center were over 2000 g/g
(Fig. 37). The crater produced by this explosion
has been called "Miller's Hole" (Fig. 38) for the
(Table 13). Over the summer of 1992, the concen-
EOD team member who detonated the round.
tration in the center appears to have decreased by
The crater produced has provided an opportu-
one order of magnitude (approximately 90%). An-
33


 Previous Page
