Table 11. Tensiometer measurements at 10 and 25
Site Number
9 8
7
6
54
3
2
1
cm deep taken at the same time as piezometer
6
measurements of water surface.
Depth* (cm) to
water surface
Tension (cbars)
Site
Date
in piezometer
10 cm deep* 25 cm deep*
Intermittent Pond
3
June 20
21
4
4
Sediment
3
Aug. 19
68
10
10
Surface
5
4
June 20
46
4
4
4
Aug. 19
75
30
20
May 24
5
June 20
>68
5
4
5
Aug. 19
>68
28
16
Mudflat
June
6
June 20
>77
9
4
20
6
Aug. 19
>77
27
21
7
June 20
>76
10
8
Aug
Piezometer
7
Aug. 19
>76
25
23
19
4
River
River Levee
Mudflat
Levee
Intermittent Pond
9
June 20
>88
23
20
Permanent Pond
9
Aug. 20
>88
38
34
5
*Depth from sediment surface.
3.546
3.548
3.550
3.552 x 10
UTM Easting (m)
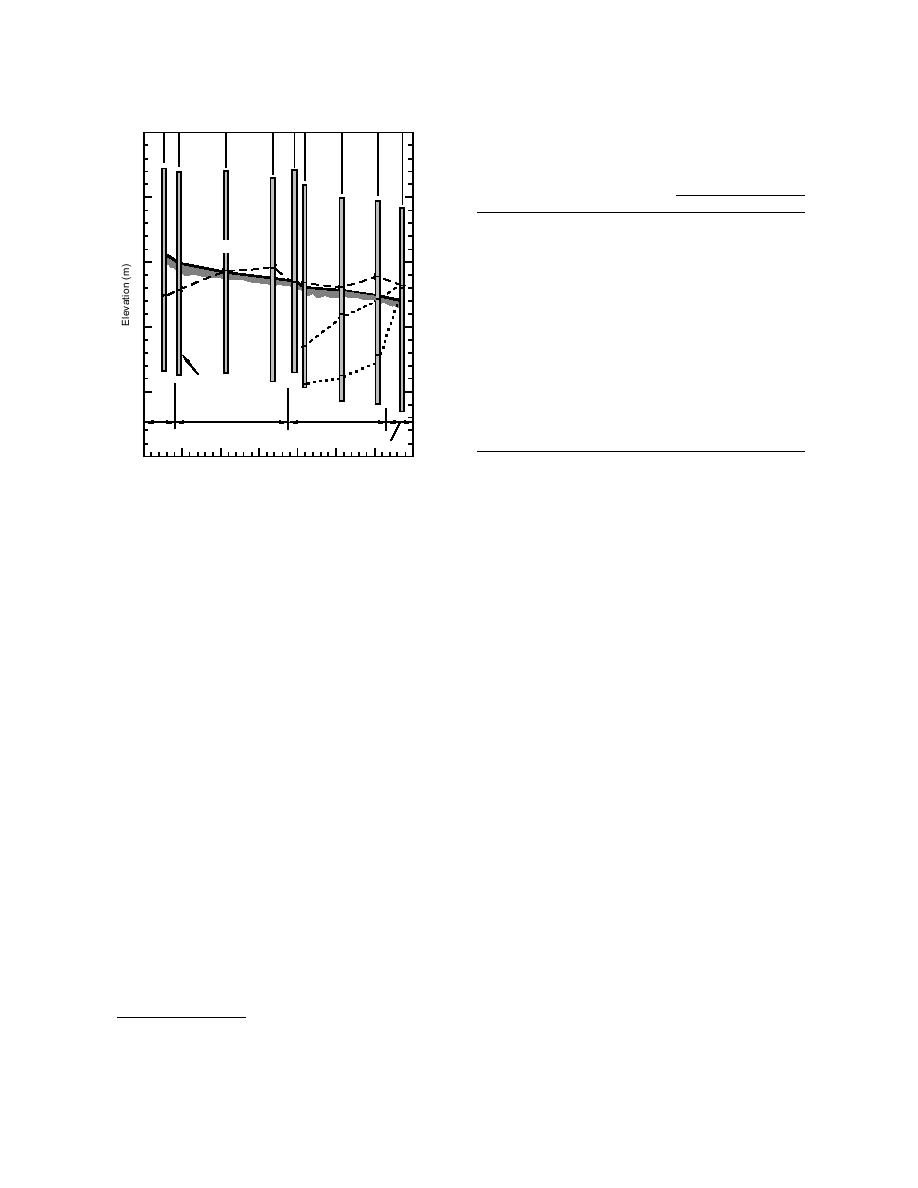
Figure 29. Water surface elevations (dashed lines)
ments. The tension exceeded 5 cbar, the estimated
measured in piezometers at sites 19 on May 24, June
air-entry value, at each site in August when the
20 and August 19.
depth to water surface was over 50 cm, indicating
that the surface sediments were below saturation
ezometers at sites 59 were dry, indicating that the
(Table 11).
water surface elevation was greater than 75 cm
These data give some insight into the relation-
below the sediment surface at each of the mudflat
ship between surface water and ground water
and river levee sites, and greater than 68 cm below
along the transect and their influence on moisture
for site 5 at the edge of the intermittent pond. East
levels in the surface sediments. At site 1, the per-
along the transect across the intermittent ponded
manently flooded site, upwelling of ground water
area, water surface elevations were 46, 21 and 4
appears to be high enough to prevent drying by
cm below the sediment surface at sites 4, 3 and 2,
evaporation. At the remaining sites, saturation of
respectively. At the permanently flooded site, the
the surface sediments appears to be primarily the
water surface elevation in the piezometer was 14
result of flooding high tides. Following a flood
cm above the sediment surface and 4 cm higher
event, a combination of downward seepage and
than the pond surface elevation. At the time of the
evaporation loss dewaters the surface sediments.
last measurement on August 19, piezometers at
Measurement of water level at permanently flooded
sites 59 were dry, and the water surface eleva-
site. The elevation of the pond surface at site 1 was
tions were lower at the remaining sites. The depth
monitored hourly from June 15 to August 27 using
to water was 75, 68 and 52 cm at sites 4, 3 and 2,
an Ultrasonic Depth Gage interfaced with a data-
respectively.* Based on the moisture retention
logger. Given that the elevation of site 1 is 4.7 m,
curve, the water surface elevation at each of these
the sensor indicates that the 24-hour average wa-
sites is sufficiently below the sediment surface to
ter depth at this site was 7.9 cm on June 15 and
desaturate the surface sediments. At site 1 the wa-
declined by approximately 0.5 cm per day until
ter surface elevation inside the piezometer was
June 21(Fig. 30). Then the series of flooding tides
again 4 cm higher than the pond surface.
on June 2325 deepened the pond to 25 cm. A full
Tensiometer measurements were taken at six
month passed before water levels returned to pre-
sites at the same time as piezometer measure-
flood levels. The first week after the last flood
event (June 25July 2), the drop averaged 1.5 cm
per day. Once the pond surface elevation reached
* Data obtained from Beth Nadeau indicated that water sur-
4.85 m, which is the elevation of site 5 at the edge
face elevation continued to drop after our August measure-
of the pond, the drop slowed to 0.5 cm per day un-
ments. On September 3, piezometers were dry at a depth of
til the water depth was 6 cm on July 21. The pond
80 cm in the intermittent pond near site 3.
28


 Previous Page
