34
34
a. 1989.
b. 1990.
33
33
8 Weeks
10 Weeks
32
32
31
31
10 20
10 20
10 20
10 20
10 20
10 20
10 20
10 20
10 20
10 20
10 20
10 20
May
Jun
Jul
Aug
Sept
Oct
May
Jun
Jul
Aug
Sept
Oct
34
34
d. 1992.
c. 1991.
33
33
32
32
9 Weeks
31
31
10 20
10 20
10 20
10 20
10 20
10 20
10 20
10 20
10 20
10 20
10 20
10 20
May
Jun
Jul
Aug
Sept
Oct
May
Jun
Jul
Aug
Sept
Oct
34
e. 1993.
11 Weeks
33
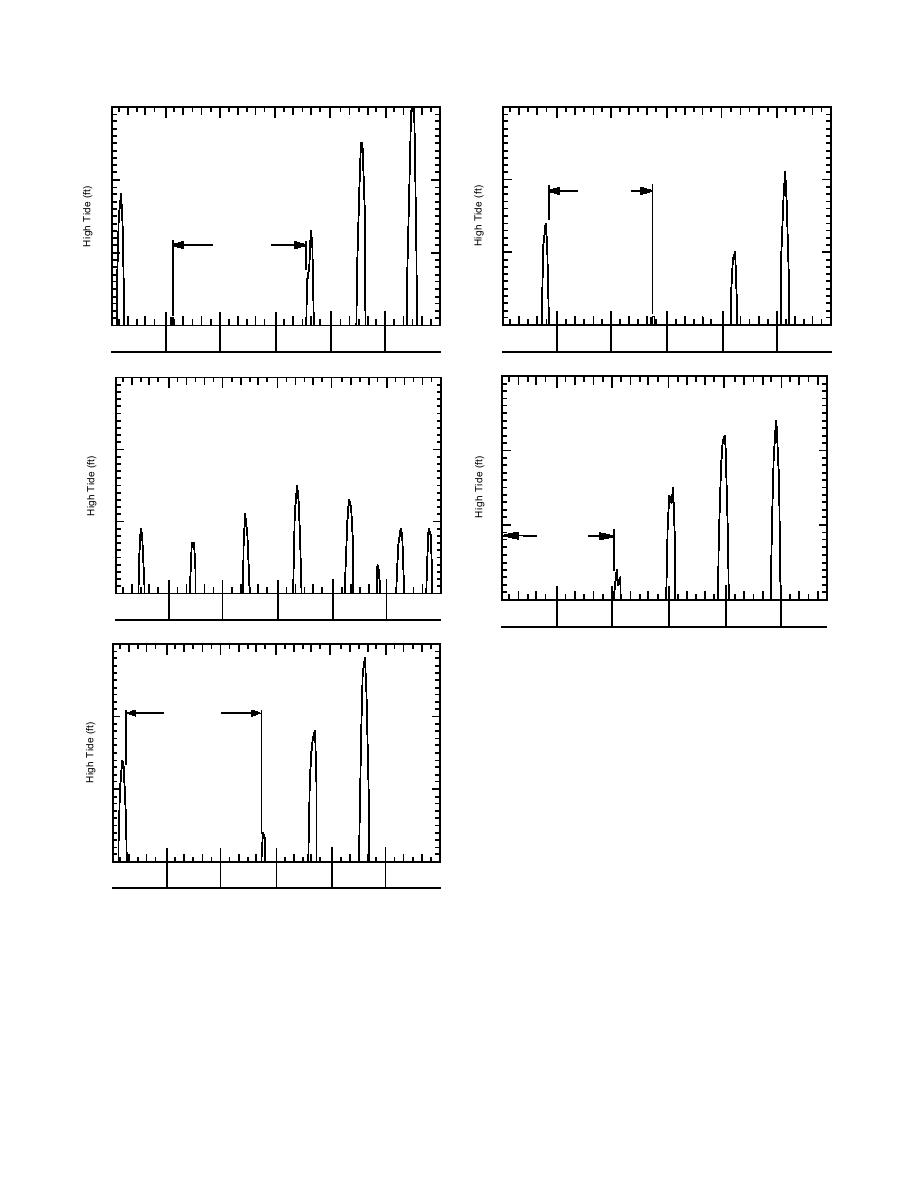
Figure 32. Frequency of flooding tides, 19891994,
assuming that the flats flooded each time Anchorage
tide tables predicted a high tide of 31 ft or greater.
32
31
10 20
10 20
10 20
10 20
10 20
10 20
May
Jun
Jul
Aug
Sept
Oct
the concentrations found in 1992 and 1994 were
Sources of uncertainty about this field-contami-
due solely to random error, the observation of an
nated site include the date it was contaminated, the
increase in concentration would be just as likely
type of round that produced the contamination
as an observation of a decrease. Of the 41 pairs
(mortar or howitzer), where the round exploded,
compared, 22 showed a decrease, 7 showed an in-
the type of fuse (point detonating or other) and the
crease, and 12 were below the detection limit (Fig.
initial white phosphorus concentration. However,
36). The number of samples showing a decrease
we do have this information for another site in the
between 1992 and 1994 is significant at the 0.05
intermittent pond of Area C, a site where unex-
significance level.
ploded ordnance (UXO), an 81-mm mortar round
31


 Previous Page
