50
distribution. The v1 and v2 results and the differ-
ence between these values nondimensionalized
40
by the corresponding mean velocity are given in
Figure 9. Except for a few points, the absolute
30
value of this dimensionless difference was less
20
than 0.04 in both records, corresponding to an
absolute value of the difference between v and
Raw Data
10
either v1 or v2 of less than 0.02 v. The delineation
Peak Data
of the limits of each radar trace and calculation of
0
a mean θ has reduced the large potential beam-
0
4
8
12
16
20
24
28
Time (min)
width error to the same order as the other minor
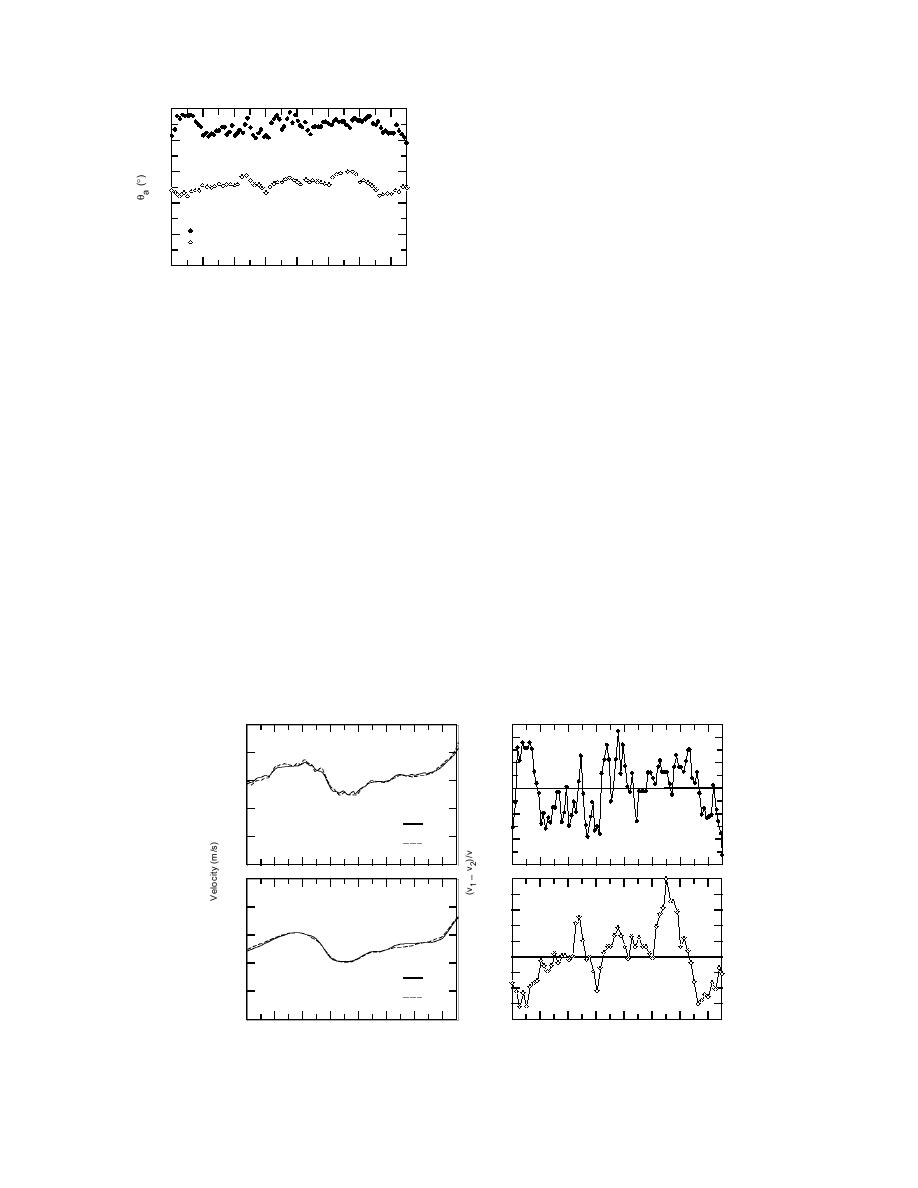
Figure 8. Calculated θa as a function of time
errors inherent in Doppler velocity measure-
ment. The peak data are smooth relative to the
for the raw and peak radar data records for the
raw data, but they are shifted systematically to
breakup event. These values result from an
equal boresight velocity requirement for the
lower velocities, following the downward shift
near and far edge traces.
of the far edge of the trace. The resulting mean
velocity of the peak radar record is 1.35 m/s, and
close to the near edge of the footprint, consistent
that of the raw radar record is 1.61 m/s.
with the inverse relationship between backscat-
The velocity data from the video record are
tered power and range to the fourth power given
shown with the selected polynomial fit and the
in eq 1.
corresponding normalized error in Figure 10.
Using eq 11 we calculated θa for both the raw
The mean and median of the normalized error
and peak detector data records; we present the
were very close to zero, with a standard devia-
respective results in Figure 8 as a function of
tion of 0.026. The maximum normalized error of
time. For the raw data record the mean, median,
about 0.06 v is within the measurement error
and mode of θa are approximately equal, with a
bound for this method (Ferrick et al. 1992). Com-
mean of 44.6, a standard deviation of 2.2, and a
parison of the radar and video velocities reveals
range of 10.0. The mean, median, and mode of
that the video results are consistently low. For
θa for the peak data record are also approximate-
ease of comparison we assume that this system-
ly equal, with a mean of 26.0, a standard devia-
atic difference is due entirely to video grid dis-
tion of 2.1, and a range of 9.4. The peak-finding
tortion. We obtain C in eq 14 from the ratio of the
algorithm significantly reduced the apparent
raw radar to video polynomial mean velocity
beam width of the radar without altering the θa
values as 1.067.
2.5
0.04
2.0
0.02
1.5
0
1.0
0.02
v1
0.5
0.04
v2
Raw Radar
Raw Radar
0
0.06
2.5
0.04
Peak Radar
Peak Radar
2.0
0.02
1.5
0
1.0
v1
0.02
0.5
v2
0
0.04
0
4
8
12
16
20
24
28
0
4
8
12
16
20
24
28
Time (min)
Time (min)
Figure 9. Ice breakup boresight velocities and their normalized difference obtained from the
edge traces, with the corresponding mean θa of both the raw and peak radar data records.
8


 Previous Page
