1.5
1.15
1.10
Far Edge
1.05
ght
Boresi
Far - edge Error
1.0
1.00
ge
Ed
r
ea
Near - edge
N
0.95
Error
0.90
0.5
Doppler Velocity
0.85
θa
Spectrogram
0.80
0.75
0
20
15
10
5
0
5
10
15
20
0
10
20
Apparent Beam Width about Boresight ()
Time (min)
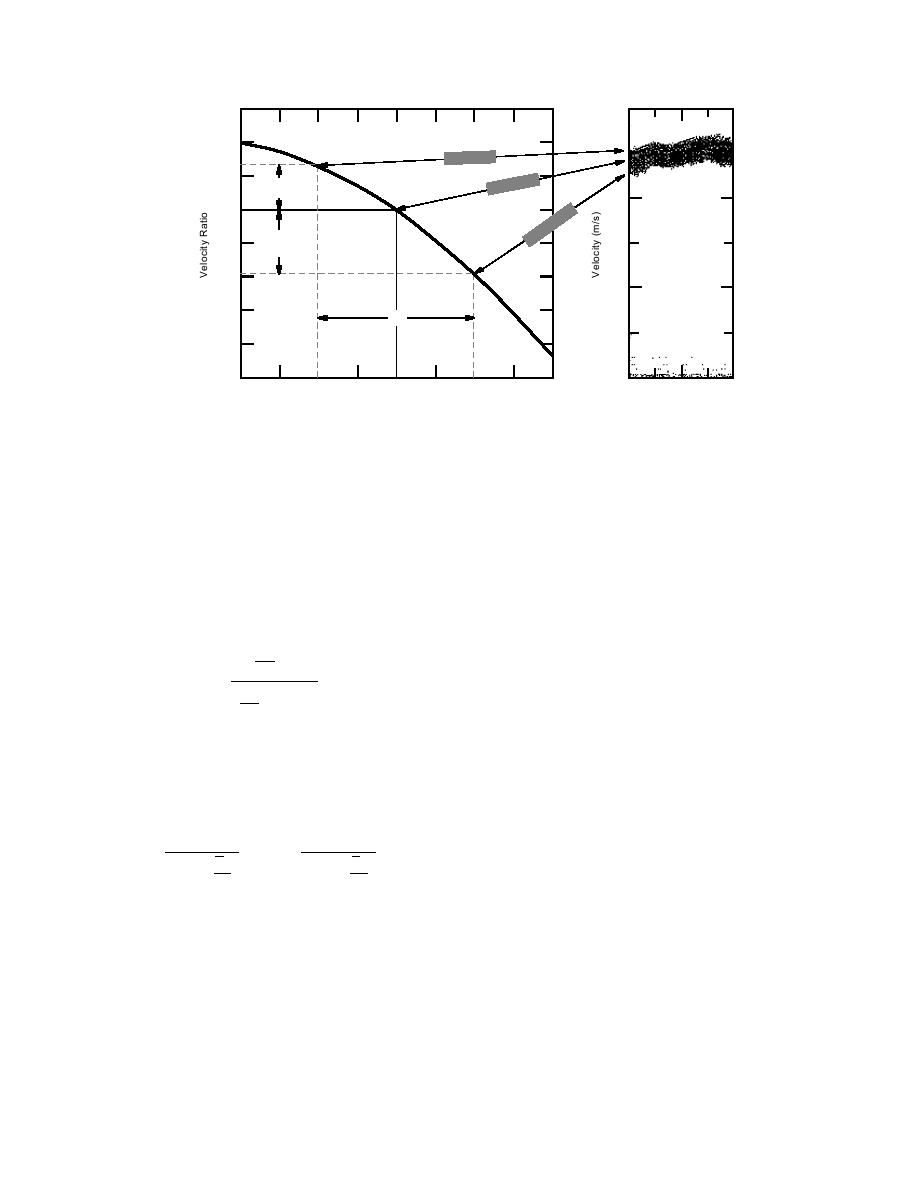
Figure 6. Example that quantifies the near- and far-edge velocity ratio with the boresight
velocity for a specific case, β = 25 and θa = 20, and relates them to specific locations on the
spectrogram.
width errors increase significantly with θa for all
ponent that provides the global variation of ice
boresight angles and increase with β for all beam
velocity with time and a comparatively rapid
widths. A sample Doppler velocity spectrogram
variation of small amplitude that represents
is related to the velocity ratio relationship for β =
measurement error or noise in the data. Separat-
25 and θa = 20 in Figure 6.
ing these components requires the development
Manipulating the relationship between the
of a function that contains most of the informa-
edge velocities in eq 9 we solve for θa as
tion in the data and little of the error or noise.
The video data were fitted with orthogonal poly-
nomials of increasing order until the maximum
v+
1
differences ceased to diminish and the time se-
v
.
1
θa = 2 tan
(11)
ries of these differences appeared random. The
v+
+ 1 tan β
polynomial, as a single-valued function of time,
v
permits quantitative comparison of the radar
and video records.
If both upper and lower bounding traces are
Prowse and Demuth (1991) emphasized the
drawn consistently, θa should vary randomly
importance of a viewing position with large free-
within a narrow range. Velocity estimates v1 and
board and accurate vertical angle measurement
v2 are obtained with the mean θa as
to obtain accurate ice velocity measurement with
a related optical method. The water levels during
cos β
cos β
breakup were much higher than those during
v+ ; v2 =
v1 =
(12)
v .
θa
θa
target setup, occupying 30% of the setup free-
cosβ +
cosβ -
board. The resulting change in vertical angle
2
2
from the camera to all points on the ice caused
distortion of the original grid by length-scale
Finally, the measured Doppler velocity v, repre-
changes that depend on position in the cross sec-
senting the bulk ice velocity within the radar
tion of the river. The open water during the frazil
footprint, is taken as the average of v1 and v2.
ice run was at a level comparable to that of the
A reference grid for video ice velocity mea-
winter ice cover. The data from both events were
surement was established by placing visual tar-
obtained along a single streamline in the river,
gets on the winter ice cover at known spacing.
providing consistent results that can be corrected
The video records of the breakup and frazil run
for a change in length scale. The velocity data ob-
events were obtained by timing ice floes through
tained from the original grid vgrid are related to
this grid. As in previous work, we assume that
the measured data contain a slowly varying com-
the actual velocity v as
6


 Previous Page
