1880
Route 85
Bridge
1840
Water Surface
Bottom of Ice
Bed
1800
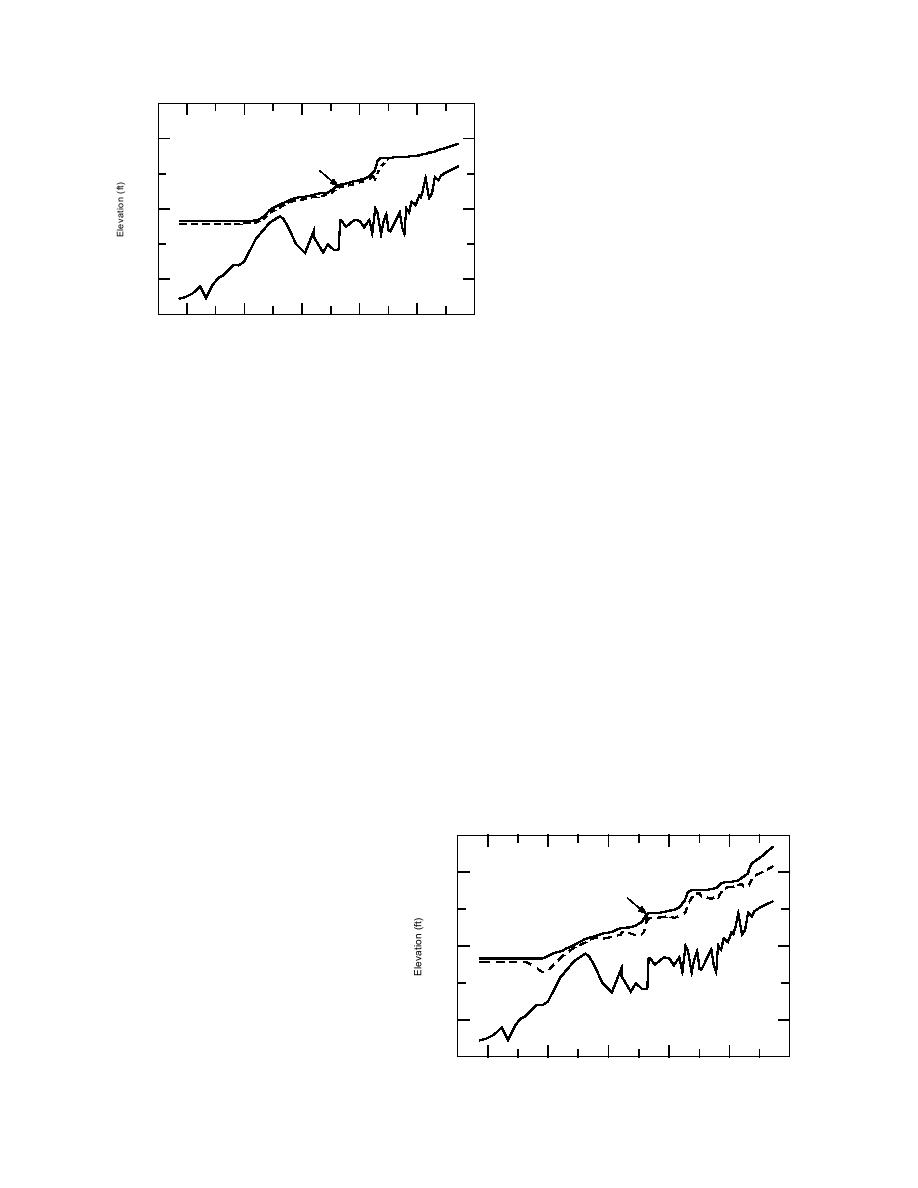
Figure 5. Simulation of the longitudinal profile of
the March 1986 ice jam in the Middle Bottom
1500
1520
1540
1560
1580
1600
area.
River Miles
Using this information the HEC2 computer
water surface elevation at the nearest cross section
program (USACE 1990) was used to calculate the
to this site, 1567.44, was 1868.75 ft msl. Consider-
resulting water surface profile as shown in Figure
ing that no ice-related calibration of the open-
5. The area of zero ice thickness, appearing as
water-verified HEC2 data file was conducted, the
a nearly vertical line through the ice cover near
agreement of the ice jam simulation with the
HEC2 cross section 1552.7, corresponds to the
known water surface elevation is surprisingly
location of the Route 85 bridge. Because the HEC
good.
2 ice option is actually a modification of the stan-
Had we not been able to obtain information on
dard bridge option, ice cannot normally be simu-
the location of the toe of the jam, we would have
lated at cross sections where the bridge code
had little alternative but to assume that a frag-
appears in a data file. Since bridge widths are
mented ice cover existed throughout the river and
quite small relative to the river lengths typically
that it was free to thicken into an equilibrium jam
modeled with HEC2, the absence of ice in the
in response to forces imposed by the flowing wa-
bridge throat has a very localized effect on the
ter. As described earlier, this assumption would
computed water surface profile. Except in the im-
result in the maximum possible water levels for a
mediate vicinity of a bridge, the effect of deleting
given discharge. A simulation of this condition
the ice cover over such a short distance is normal-
was also run (Fig. 6), and the computed water sur-
ly negligible. Another option is to delete the
face elevation in the vicinity of the Borlaug Bridge
bridge from the simulation if the ice effects are de-
was 1870.13. Thus, assuming a fully developed ice
termined to be of greater significance.
jam below the known (or estimated) toe of the jam
In this jam, water reached the elevation of the
resulted in a computed water surface elevation
road at the Borlaug Bridge site in the Middle Bot-
1.38 ft higher than that computed using the known
tom. A Corps of Engineers survey found this loca-
toe location. Areas closer to the toe of the jam
tion, as identified in a photograph, to have an ele-
would have been more severely affected by the
vation of 1868.5. Although it is difficult to deter-
difference in assumptions, while points farther
mine accurately from the figure, the computed
upstream would have seen lesser or no effect.
1880
Route 85
Bridge
1840
Water Surface
Bottom of Ice
Bed
1800
Figure 6. Simulation of the longitudinal profile of a
fully developed ice jam throughout the Buford
1500
1520
1540
1560
1580
1600
Trenton area.
River Miles
11


 Previous Page
