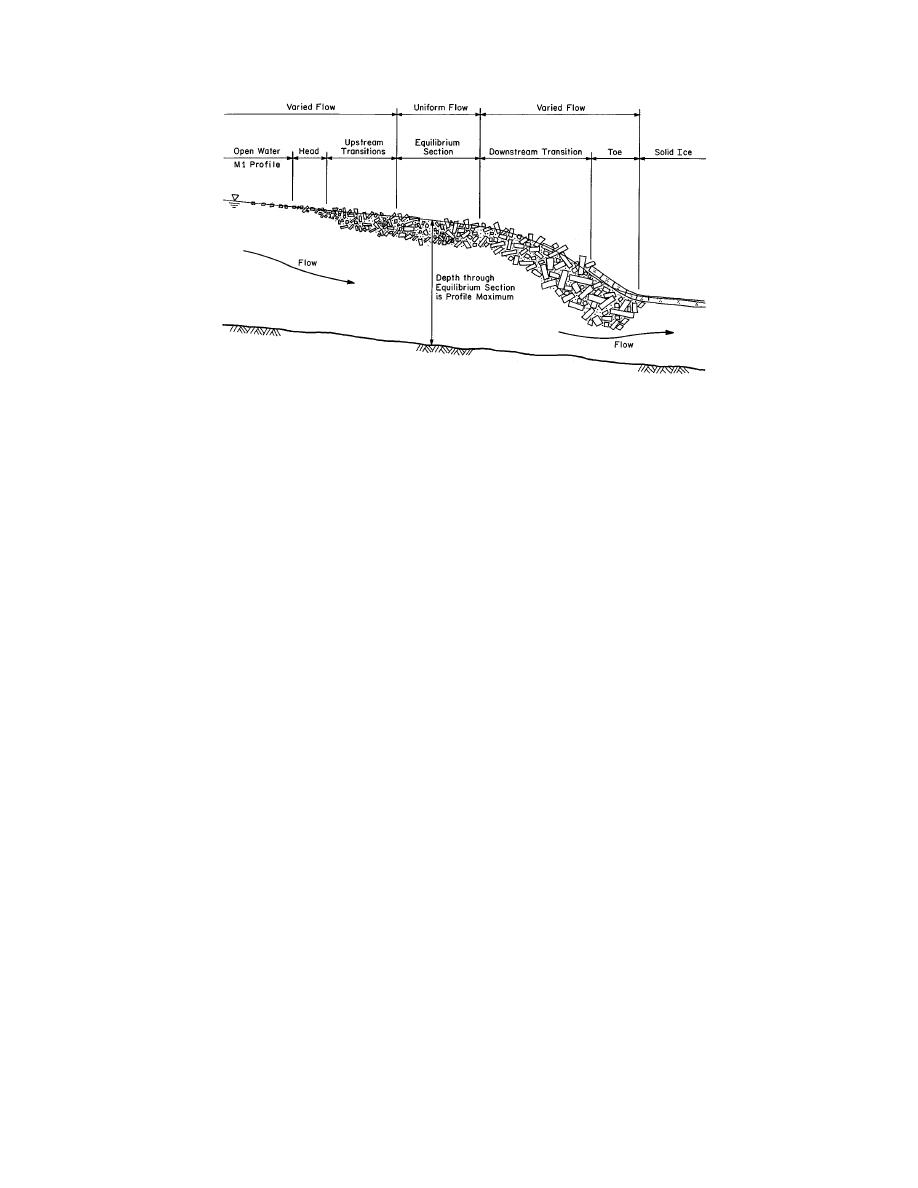
Figure 4. Longitudinal profile of a typical breakup ice jam.
jam is long enough, a fully developed or equilibri-
within the equilibrium portion of the jam de-
um jam reach may form, in which ice and flow
scribed earlier. Since ice and flow conditions are
conditions are relatively uniform. From the up-
relatively uniform within the equilibrium reach, it
stream end, or head, of the jam, flow depths again
is fairly simple to estimate the water levels in this
gradually decrease towards the lower flow depths
portion of the jam. Depending on where a jam
associated with the open-water conditions up-
forms and whether there is a sufficient upstream
stream. Further information on ice and ice jam
ice discharge to form a jam long enough to devel-
processes can be found in EM 111021612
op an equilibrium reach, actual water levels may
(USACE 1982a).
be less and the estimate will be conservative.
Ice-related flooding tends to be local and high-
ly site specific. Without prior field observations, it
March 1986 ice jam simulation
is difficult to predict where, or even if, ice jams
For the 1986 event we have information on the
will form along a river. Unfortunately no signifi-
ice jam that occurred in the vicinity of Hurley
cant ice jams occurred during the current study
Bend in the Middle Bottom. We know the maxi-
period. Thus, analyses of ice-related flooding
mum stage and the approximate locations of the
must rely heavily on the historical data obtained
head and toe of the jam, and we know that most of
through the visits with local residents described
the ice remained in the channel and that the jam
earlier. One of the best-documented events (and
released while at the maximum stage. Further,
also the most recent) occurred in March 1986. The
knowing that the maximum stage was reached on
jams associated with this event were severe, near-
March 1st allows us to estimate the water dis-
ly overtopping laterals in both the Middle and
charge and Lake Sakakawea stage on that day. The
West Bottoms, and they provide a good test of our
discharge was estimated to be 59,500 cfs on the
ability to simulate ice jam processes in this reach
Missouri River and 45,000 cfs on the Yellowstone
of the Missouri River. The 1986 event will also
River, while the Lake Sakakawea stage was taken
provide a basis for simulating potential flood lev-
to be 1833.2. Below the toe of the jam (cross section
els for other ice jam events.
1563.22), it was assumed that there was an intact
Lacking field data, it is very difficult to predict
ice sheet 1.5 ft thick, and above the head of the jam
where, and with what severity, jams will form
(cross section 1570.13) there was open water. The
along a river. Major obstacles to be overcome in-
roughness of the ice sheet and jam were unknown,
clude estimating the appropriate ice conditions at
so the default values supplied by the ICETHK pro-
a particular site. Analysis is often limited to esti-
gram (Wuebben and Gagnon, in prep.) were as-
mating the upper and lower limits of probable
sumed. These values include n = 0.025 for sheet ice
stages. If a jam is known (or assumed) to form at a
and the default n-value calculation scheme for ice
given location, it is possible to estimate the maxi-
jams contained in the ICETHK program. This cal-
mum resulting flood levels. It can be shown that
culation scheme is based on an empirical predic-
for a given scenario of water discharge and ice
tive relation developed to describe the ice accu-
conditions, the maximum water levels will occur
mulation roughness data of Nezhikovskiy (1964).
10


 Previous Page
