26 103
1848
Flow
24
22
Stage
1847
20
18
16
1846
140
144
148
152
156
160
Julian Day (water year)
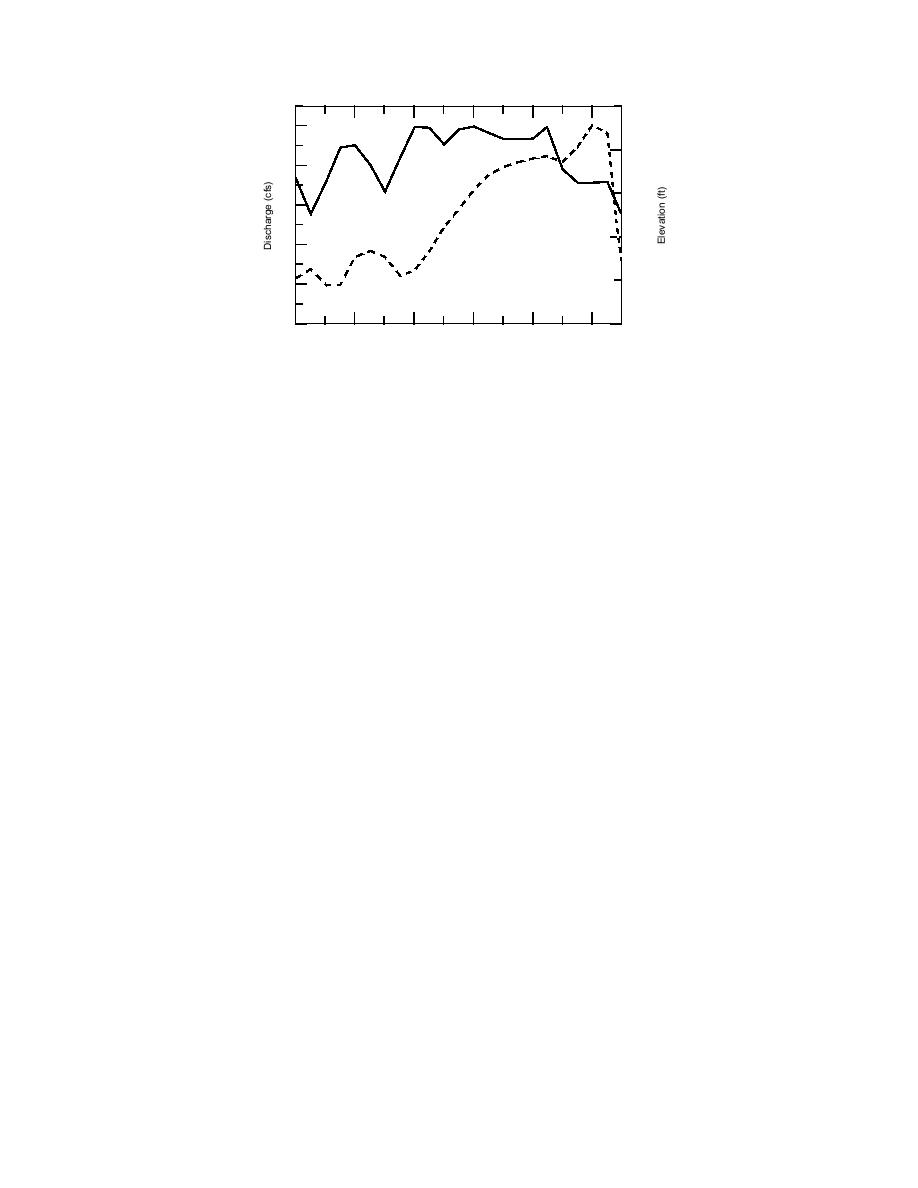
Figure 3. Flow and stage record during the 1992 breakup.
Figure 3 also shows stage data for the water level
cover or ice jam on a river roughly doubles the
gage located at the Route 85 bridge over the Mis-
wetted perimeter of a wide channel. The added
souri River. This gage (located at HEC2 cross sec-
resistance to flow caused by the ice cover, along
tion 1552.70) shows an increase in stage during the
with the reduction in flow area caused by the ice,
decrease in discharge beginning on 6 March,
results in higher stages than a comparable open-
which suggests a short-term ice stoppage or jam
water discharge would produce. This is particular-
downstream. The record also reveals a drop in
ly true for ice jams, which can cause flood stages
stage of over 3 ft after 9 March, reflecting the re-
comparable to rare open-water events despite dis-
lease of a jam or loss of ice cover in reaches farther
charge recurrence intervals on the order of two
downstream. No gage records were available be-
years or less (exceedance probabilities on the or-
tween this gage and the confluence area. Lake
der of 0.5 or greater).
Sakakawea water levels during the breakup peri-
An ice jam is defined as a stationary accumula-
od varied gradually from 1820.8 ft msl on 3 March
tion of fragmented ice or frazil that restricts flow
1992 to 1821.2 ft msl on 9 March 1992.
(IAHR 1986). These accumulations include freeze-
The ice cover in the BufordTrenton area went
up jams as well as breakup jams. Freezeup jams
out prior to any large increase in water discharge,
are formed by the collection of pieces of floating
reflecting a loss of ice strength. No significant ice
ice during the periods of relatively steady flow ex-
accumulations were observed, fluctuations in the
perienced when the ice cover initially forms early
water surface elevation were generally less than 3
in the winter season. Breakup jams, on the other
ft, and the bulk of the fluctuations were negative,
hand, form during the often highly unsteady flow
decreasing from pre-breakup levels. All flows re-
conditions when the ice cover breaks up because
mained well within the riverbanks, no flooding
of a significant rainfall, snowmelt or other increase
occurred and at no time was there any indication
in runoff. The longitudinal profile of a typical
that there was a significant potential for flooding.
breakup ice jam is shown in Figure 4. In the case of
While it was fortunate that no damaging ice-re-
the Missouri River along the BufordTrenton Irri-
lated flood event occurred in 1992, it was unfortu-
gation District, it is the breakup jam scenario that
nate for the purposes of this study that the 1991-92
is of concern.
ice season was uneventful, yielding little informa-
Most breakup ice jams are the result of ice mov-
tion on the character of spring breakup on the Yel-
ing downstream until it encounters a significant
lowstone and Missouri Rivers above Williston.
reduction in water surface slope or a strong, intact
downstream ice cover or other surface obstruc-
tion. Downstream of the jam the flow may be uni-
ANALYSIS
form (at least in a reach-averaged sense). At the
In contrast to open-water flooding, where high
downstream end, or toe, of the jam, the ice accu-
water levels directly result from excessive water
mulation results in a gradually varied flow profile
in the transition reach as the water depth increases
discharge, ice-affected flooding results from add-
towards the deeper normal flow depth associated
ed resistance to flow and blockage of flow caused
with the thicker, rougher ice conditions. If the ice
by accumulations of ice. The formation of an ice
9


 Previous Page
