Table 4. Average rear resistance coefficient and
standard deviations by data set.
Average
Average
Data
Number of
Avg. resistance
Standard
snow depth
snow density
(Mg/m3)
set
observations
coefficient
deviation
(cm)
1
4
0.0207
0.0095
15.6
0.165
2
4
0.0171
0.0044
17.6
0.160
3
8
0.0056
0.0036
20.0
0.220
4
12
0.0140
0.0061
22.2
0.220
5
6
0.0728
0.0120
33.8
0.160
6
4
0.0068
0.0039
12.6
0.110
7
6
0.0199
0.0072
15.4
0.110
8
2
0.0152
----
15.8
0.250
9
4
0.0378
0.0168
14.6
0.230
the ratio of rear tire motion resistance to front tire
under clearly different conditions were not in-
cluded in the analysis. Data set 5, which clearly has
This analysis was done set by set and for all of the
a higher resistance coefficient, was neglected since
data combined. No clear dependence was found
it was obtained in snow that was much deeper
between any of the variables and any of the rear
than that in the other data sets. Data sets 6 and 8
tire motion resistance "parameters."
were obtained by towing the CIV in the ruts that
It was next hypothesized that the rear tire mo-
were made by the tow vehicle, thus the trailing tire
data are actually the fourth pass over the snow
stant (at least for the CIV) under similar test condi-
cover.
tions. To investigate this hypothesis, the average
Inspection of the remaining data sets (1, 2, 3, 4,
and standard deviation for each data set were
7 and 9) showed that the average values of the
calculated (Table 4); those sets that were collected
highest (set 9) and lowest (set 3) didn't seem to
99.9
99.0
95.0
80.0
50.0
20.0
5.0
1.0
0.1
0
0.01
0.02
0.03
0.04
0.05
0.06
0.07
0.08
Trailing Tire Resistance Coefficient
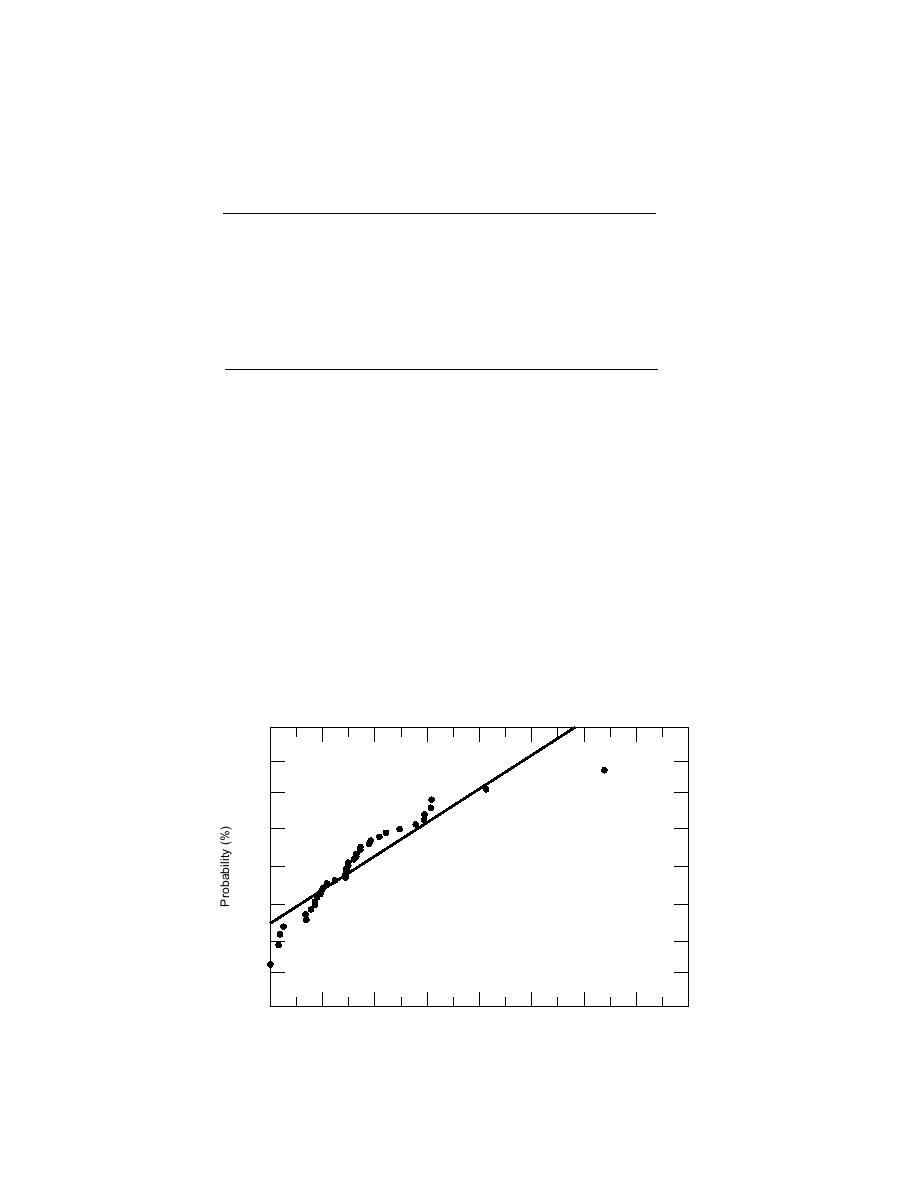
Figure 5. Normal probability plot.
8


 Previous Page
