6
Time of Flooding
Tide
Parachute Dr.
Chart
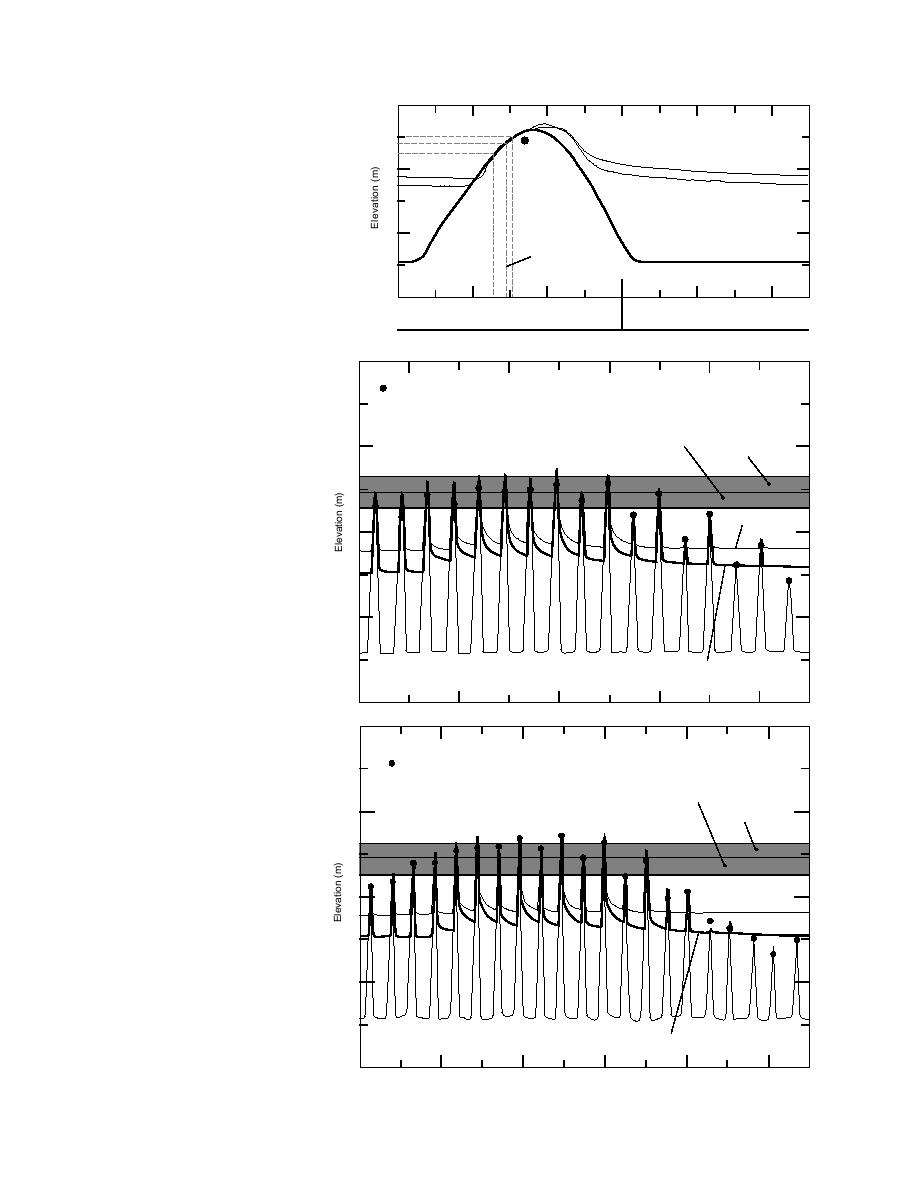
Figure 16. Water elevation at three
4
sites during the 19 August evening
Bread Truck Dr.
flood event. The base level shown on
Parachute Dr.
the Knik Arm plot is equal to atmo-
2
spheric pressure measured when the
Knik Arm
Knik Arm
(coast)
(coast)
sensor is exposed in air.
Bread Truck Dr.
0
18:00
20:00
22:00
04:00
02:00
19 Aug '93
20 Aug
8
Tide Chart
Mudflat/Pond
6
Levee
Parachute Dr.
4
a. August.
2
Knik Arm
Bread Truck Dr.
Figure 17. Water elevations at three sites
during a period of flooding cycles. Knik
0
Arm represents the tidal cycle external to
17 Aug '93
19
21
23
25
ERF proper. In August, Parachute and
8
Bread Truck data show peak heights
greater than predicted due to various fac-
Tide Chart
tors including high river flow, but little
augmentation over predicted heights in
Mudflat/Pond
6
September.
Levee
4
Parachute Dr.
b. September.
2
Knik Arm
Bread Truck Dr.
0
14 Sep '93
16
18
20
22
24
18


 Previous Page
