5.8
5.6
5.4
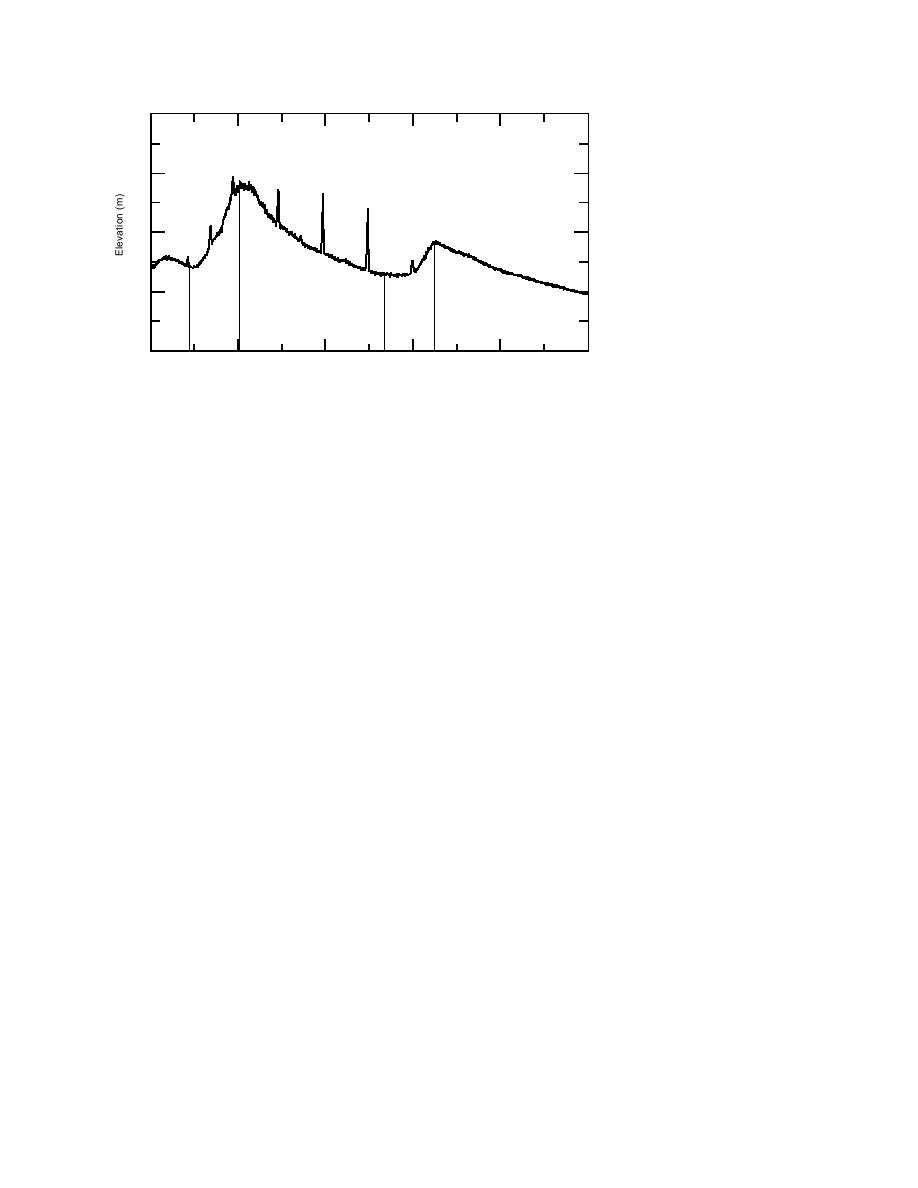
Figure 18. Elevation of waters
in Eagle River during Septem-
5.2
Rain
Rain
ber flooding cycles. Rainfall in
(0.96 in)
(0.18 in)
the watershed affected elevation
twice during the September tidal
5.0
cycles.
15 Sep '93
17
19
21
23
25
showing primarily the effects of a high glacial
tling-out of sediment suspended in the water col-
meltwater discharge in the Eagle River (Fig.
umn (Table 3) and, presumably, sediments are
17a). Precipitation and wind were not factors
deposited mainly following slack high tide. Thus,
during this time.
the longer the period of inundation, the greater
Water heights measured at these same sites
the time for sediment in suspension to be depos-
during tidal flooding in August and September
ited. In addition, the mixing and exchange of
illustrate the seasonal shift from higher to lower
flood waters with the original pond and marsh
discharge as melting of glacial river sources is
waters increases the amount of sediment sus-
reduced (Fig. 17b). Flood heights generally ex-
pended in the ponds and marshes, and provides
ceed the tide chart predictions for Anchorage in
the primary source of newly deposited materials.
August, until the discharge decreased around 22
The timing of flooding is a function of both the
August. In September, flood heights generally
elevation of the levees and mudflats surrounding
match predicted tide levels; whenever they ex-
the gullies, and of the distance of the gully head-
ceeded those levels, river discharge had been in-
wall from the coast. Water moving down the riv-
creased by rainfall in the Eagle River watershed
er can also alter the timing of flooding inland
(Fig. 18).
from the coast, depending upon its volume rela-
tive to the volume of tidal waters. A quantitative
relationship for these factors is not yet devel-
WATER QUALITY PARAMETERS AND
oped, and thus the relative duration of inunda-
TIDAL FLATS HYDROLOGY
tion per tidal flooding cannot be predicted.
Water quality during tidal influx and efflux is
Water level measurements at the river and
critical to understanding the interplay of tidal
gully sites (Fig. 11) verified our visual observa-
flood waters and river discharge and to examin-
tions that the flood cycle normally results in a
ing their role in the erosion, transport and depo-
progressive rise in the river channel and gully
sition of sediment within the Flats. Water quali-
water levels before a gradual flooding of the tidal
ty parameters were only measured during two
flats takes place. This progression is illustrated
summer months (August and September), so
by water height changes at the three sites during
that we can only speculate on the overall role of
a tidal inundation in August (Fig. 16). Flooding
tidal and riverine water sources. The relative im-
begins first within the coastal mudflats on Knik
portance of these parameters as a data source
Arm, while water is progressively moving inland
can, however, be illustrated by examining varia-
up the Eagle River channel and the tributary gul-
tions in selected parameters during a flood and
lies before it spills onto the inner mudflats first
ebb cycle at the Bread Truck Pond gully on 18
at the Bread Truck gully and then at Parachute
August 1993, at the Bread Truck and Parachute
gully. Water levels decline first in the coastal
gully sites on 1920 August, and at both sites on
zone, actually while tidal flood waters are still
1819 September.
moving up Otter Creek and into the southwest-
Data during the flood and ebb cycle of 18
ern corner of the Flats.
August show the basic relationships of water
Water levels were also greater than predicted
quality parameters to inundation (Fig. 19). As
for the Anchorage datum from 1722 August,
19


 Previous Page
