graduated scale on its face was inserted into
the pond bottom, and the height of the pond
bottom and the water column were measured
to provide a second measure of the net sedi-
mentation rate (a on Fig. 7). Any wind waves
or water surface glare on sunny days, howev-
er, commonly made this a difficult measure-
ment to obtain. In addition, aquatic vegeta-
tion on the bed commonly covered the base of
the scale. For these reasons, only water level
measurements are now recorded.
Gully erosion and recession
Gullies* draining the ponds and mudflats
are actively extending inland by headwall
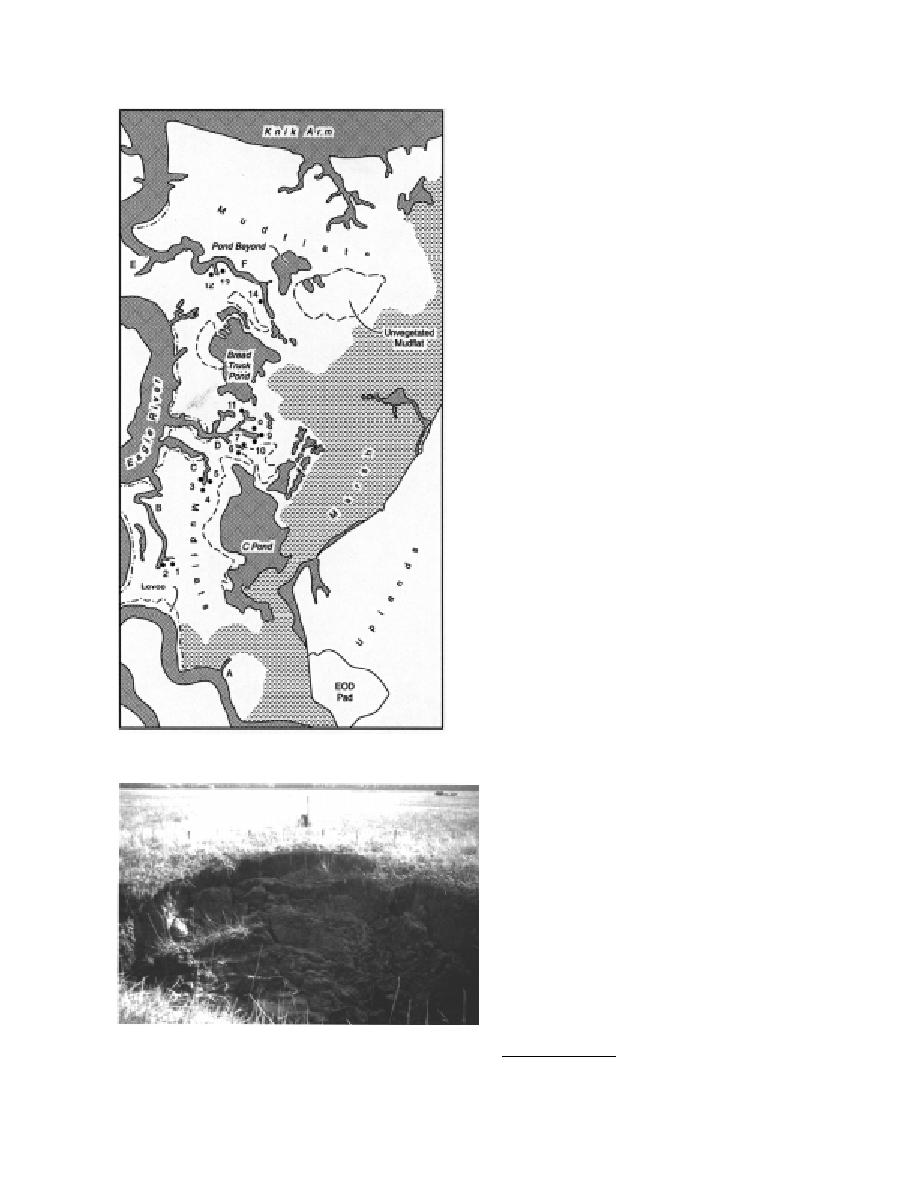
and lateral wall erosion and recession. We es-
tablished 14 sites to evaluate retreat rates (Fig.
8); 11 sites were established in June 1992, 3 in
June 1993. At each site, stakes were driven
into the ground along a straight line at known
distances from one another and from the crest
of the gully (Fig. 9). A "hub" stake was set at
a known distance from this stake line. The
distance between the hub and the crest of the
gully scarp was measured across the top of
each line stake in succession with a tape mea-
sure. The position of the gully scarp was
identified with a plumb bob suspended from
the tape measure. Flagged wire stakes were
then placed at each point of measurement
along the headwall.
Measurements were repeated in September
1992, June 1993 and September 1993 after
tidal inundation. On the basis of repeated
measurements at points without any retreat
Figure 8. Location of gully headwall erosion study
(as indicated by the continuing presence of
sites.
wire flags), we consider these measurements
reproducible at 25 cm. The accuracy, how-
ever, is limited by how well the crest of the
gully scarp can be defined, the shape of
which is highly irregular, and therefore accu-
racy is probably limited to 10 cm.
The elevations of the bed along the length
of several gullies were surveyed, beginning at
or near the Eagle River and continuing into
the ponds (Fig. 10). These gradients were cal-
culated from these data for characteristic
reaches in each gully. Gradients were incor-
porated into estimates of gully discharge and
current velocity at surveyed cross sections
during maximum or bankfull ebb.
Figure 9. Headwall erosion study site. The line of stakes
approximately parallels the gully crest. The hub stake is to the
right of center behind the stake line.
* The terms gully and drainage are used interchangably.
7


 Previous Page
