The magnitude and variability in factors such as
sediment supply, tidal regime, sea-level chang-
es, local climate and storms, and wave and river
activity can alter the relative importance and in-
teraction of the physical processes in ways that
remain poorly defined (e.g., Boon 1975, Frostick
and McCave 1979, Carling 1981, Collins et al.
1987, Dionne 1988, Stoddart et al. 1989, Reed
1990, Dalrymple et al. 1992, Andrew and Cooper
1993). The role of glacial rivers and glacialma-
rine sediment discharges in tidal flat and salt
marsh sedimentology have received only limit-
ed attention (Ovenshine et al. 1976a,b; McCann
et al. 1981; Bartsch-Winkler and Ovenshine
1984). Neither the sediment fluxes nor the sedi-
ment budget of tidal flats and salt marshes are
sufficiently defined to link their hydrology and
sedimentology (e.g., Frostick and McCave 1979,
Kohsiek et al. 1981).
Field studies and simulations of short-term
sediment accumulation have suggested that pro-
cess and morphology are related to elevation,
and thus the annual frequency and depth of in-
undation and sediment supply, but that long-
term rates may be more importantly controlled
by the eustatic rise in sea level (e.g., Krone 1987;
Allen 1990a,b; French 1991, 1993; French and
Spencer 1993; McLaren et al. 1993). Spatial varia-
tions in the texture and composition of sediment
deposited within tidal flats and salt marshes are
also expected to relate to the hydrological pro-
cesses of tidal channels and gullies, as well as
tidal currents (e.g., Carling 1982, Allen 1992).
Sediment balance and the accretion and ero-
sion of sediment in tidal flats and salt marshes
have been estimated using short-term vertical
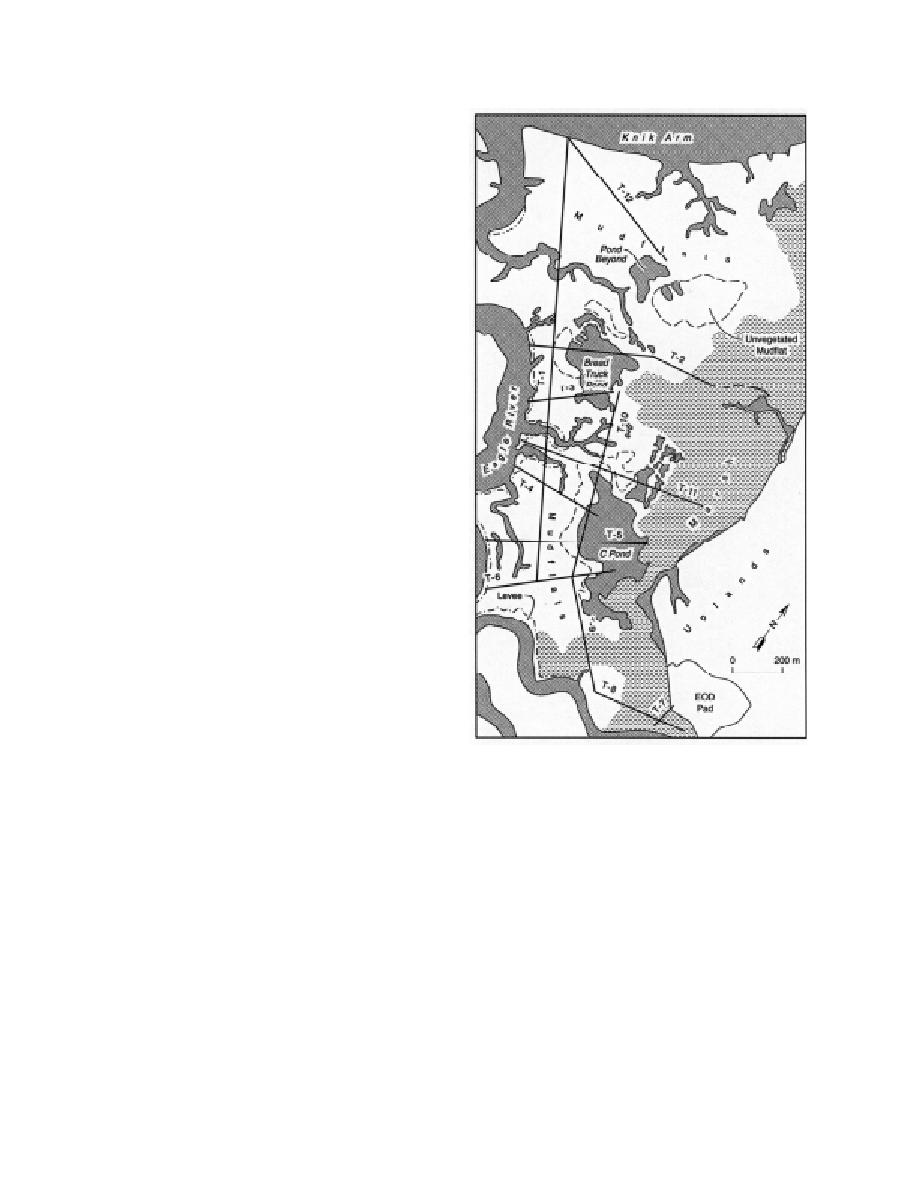
a. Surveyed transects within areas from the EOD pad
sedimentation rates (e.g., Harrison and Bloom
north to the Knik Arm coast.
1977, Richard 1978, Letzch and Frey 1980, Stod-
dart et al. 1989). Longer-term estimates have
Figure 4. Location of sedimentation study sites.
been made by dating subsurface horizons (e.g.,
Hubbard and Stebbings 1968, Allen and Rae
levees, gullies, upper vegetated mudflats and
1988) and creating radionuclide profiles (e.g.,
lower unvegetated mudflats adjacent to ponds
Bloom 1984, Keene 1971, Kearney and Ward
and marshes.
1986). Both estimates, however, may be mislead-
Eleven transects across the representative
ing owing to compaction after deposition in the
morphologic units of the study area were estab-
former case and time-dependent accretion rates
lished in May 1992, with one additional added
in the latter (French 1993).
in June 1993 (Fig. 4a) (Lawson and Brockett
1993). Surveying established ground surface ele-
STUDY AREA AND METHODS
vations on each transect relative to local bench-
marks and the UTM grid. Grab samples of the
This study focused on the central area of ERF,
surface sediment (to 5 cm depth) were taken at
east of the Eagle River, extending from west of
each survey point (Fig. 4b) for analysis of the
the EOD pad to the outer coast (Fig. 2). The
grain size distribution using standard sieving
morphological terrain units in this area are
4


 Previous Page
