1994 Arctic Ocean Section
contains a large amount of liquid or ice
water, as is the case with these multiple-
layered cloud systems, a large portion of
the sun's energy is reflected back to space
or absorbed by the atmosphere before
reaching the surface.
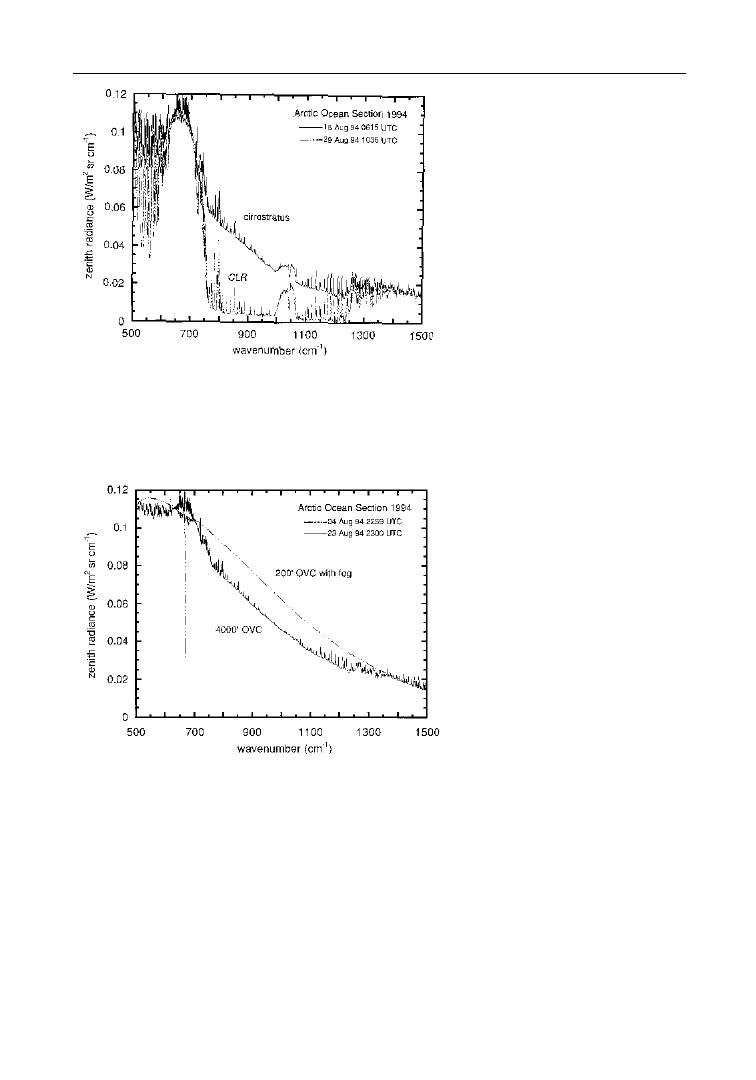
Two examples of atmospheric emis-
sion spectra from the CalSpace FTIR in-
strument are shown in the figure to the
left, under low atmospheric opacity.
Here the instrument is measuring ter-
restrial energy trapped by the atmosphere
and emitted straight back down toward
Atmospheric
emission spectra
this plot. The dotted curve, obtained under clear skies, shows that there is
measured by the Cal-
very little energy being trapped and re-emitted by the atmosphere in the win-
Space FTIR under
conditions of low
dow, meaning that most is escaping to space. For wave numbers shorter than
atmospheric opacity.
800 and longer than 1300 cm1, the atmosphere is largely opaque, and most
of the energy emitted by the Earth's
surface at these wave numbers is always
trapped by carbon dioxide and water
vapor. The upper (solid) curve was ob-
tained under a high ice cloud, and we
can see that in the window this cloud
results in nearly an order of magnitude
more energy at the ocean surface.
The figure to the left shows two
FTIR emission spectra obtained under
overcast skies (the most frequent sky
condition during AOS-94). The upper
(dotted) curve was obtained on 4 Au-
gust, the same day as the AVHRR and
solar radiometer data discussed above. At the time of this measurement there
Atmospheric emission
spectra measured
was so much liquid water in the atmosphere that the atmosphere radiated
by the CalSpace FTIR
energy to the surface almost like a perfect blackbody, as signified by the smooth-
under conditions
ness of this curve. In this situation, when we have a combination of high
of high atmospheric
opacity.
cloud layers appearing very cold in the satellite data (that is, they are radiating
relatively little energy to space) and low cloud layers radiating nearly as much
energy as possible to the surface, at nearly the surface temperature, the green-
house effect of the atmosphere is nearly at a maximum. The lower (solid) curve
was obtained under a single-layer stratus cloud. The middle infrared window is
almost but not quite closed. This is because the cloud base is several degrees
colder than the surface and because the cloud emissivity is less than one, mean-
76


 Previous Page
