Cloud Radiation
(AVHRR), which measure radiation at five visible and infrared wavelengths. The
Defense Meteorological Satellite Program (DMSP) satellites were also tracked,
giving this project access to the special sensor microwave imager (SSM/I), which
was used to map sea ice along the expedition's track. Throughout the cruise,
the Polar Sea TeraScan facility tracked between five and ten satellite overpasses
per day.
The third component consisted of a Fourier transform infrared (FTIR)
spectroradiometer operating in the middle infrared (520 m) with a spectral
resolution of 1 cm1 (Lubin 1994). FTIR data collection was coordinated
with the NOAA satellite overpasses, and a total of 178 sky scenes were studied
with the FTIR instruments. This instrument made detailed measurements of
radiation trapped by the atmosphere in the middle-infrared window (813
m). Under clear skies the atmosphere is relatively transparent in this wave-
length range, and a large portion of the heat given off by the ocean surface
escapes to space. Under cloudy skies, this window is mostly closed, meaning
that far less radiation escapes to space and the greenhouse effect is enhanced.
These greenhouse enhancements due to clouds are more than an order of
magnitude larger than what is expected from a doubling of carbon dioxide in
the atmosphere, so understanding the role of clouds in the atmospheric ener-
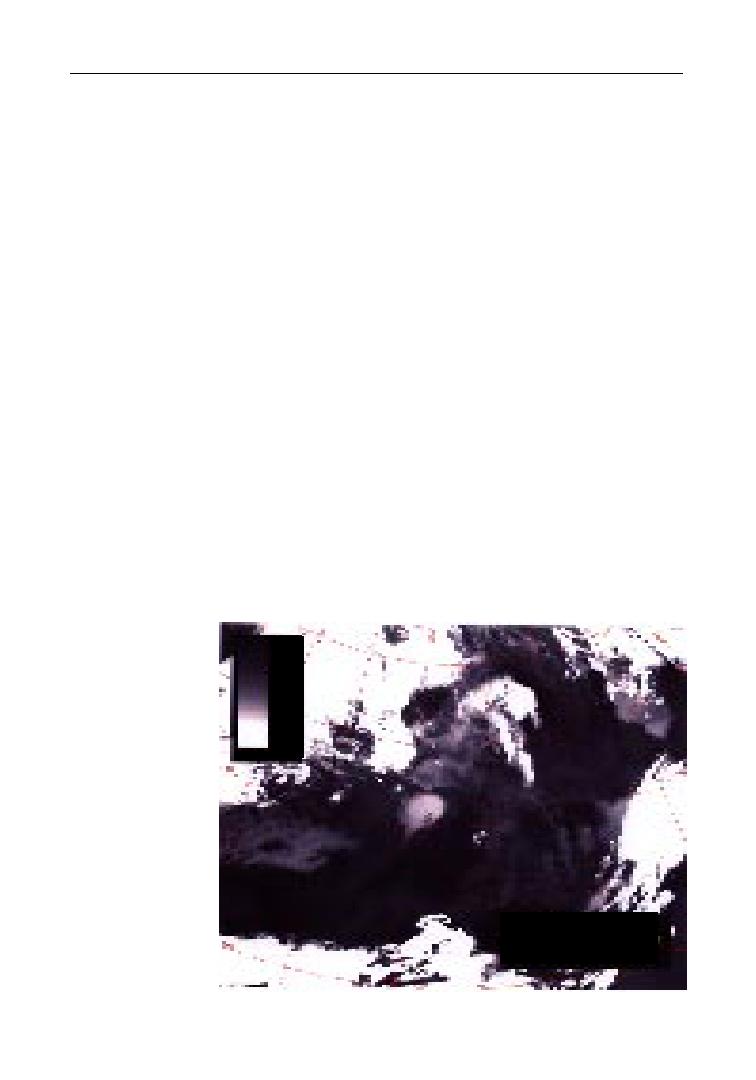
gy balance is critical before we can make meaningful "global warming" predic- AVHRR image
obtained from the
tions with GCMs.
shipboard TeraScan
During the summer of 1994, the atmosphere over the Arctic Ocean exhib- system on 4 August
ited a great deal of complexity, much more than is now represented in the 1994 during AOS-
94. Brighter shading
GCMs. A common occurrence was multiple-layered cloud systems. The ac- refers to lower cloud
emitted by the Arctic
oceanatmosphere
0
system to space, ex-
4
pressed in units of
8
equivalent brightness
12
temperature. At the
16
time of this satellite
Deg C
overpass (4 August)
the Polar Sea was at
78N, roughly in the
center of the image,
where there were three
distinct temperature
ranges in the cloud
fields corresponding
NOAA-12 AVHRR
to three distinct rang-
Channel 4 (Deep infrared)
es in cloud top height.
04 August 1994 0057Z
When the atmosphere
75


 Previous Page
