and samples were stored for later analysis. Air was also drawn through a stain-
less steel sampling line mounted 22 m above the water line above the port
flying bridge. The line was routed to the laboratory, where samples were precon-
centrated and then immediately analyzed by in-situ gas chromatography. Canis-
ters could also be analyzed by this system for intercomparison measurements
with our laboratory in Toronto.
Because the location of the sampling line was fixed, this second method of
sampling could only be used when a substantial breeze (more than 3 m/s) was
blowing off the port side of the ship. This was necessary to avoid sampling
emissions from the vessel itself, and it essentially limited sampling to times
when the ship was stopped for science stations and when other sources of
contamination (such as helicopters) were absent. Suitable conditions for sam-
pling were determined by monitoring the real-time output of carbon monox-
ide and condensation nuclei counter instru-
1000
ments. Sampling with the portable canister sys-
tem was more flexible and allowed air to be
900
collected from any upwind location on the ship
or even on the ice if conditions warranted it. In
total 113 canister samples and 53 direct sam-
800
ples were collected; 40 of the canister samples
were analyzed with the on-board gas chromat-
700
ography system.
Canister data are available for the low-
600
molecular-weight alkanes and acetylene. Dur-
70
80
90
80
Latitude (N)
Pacific
Atlantic
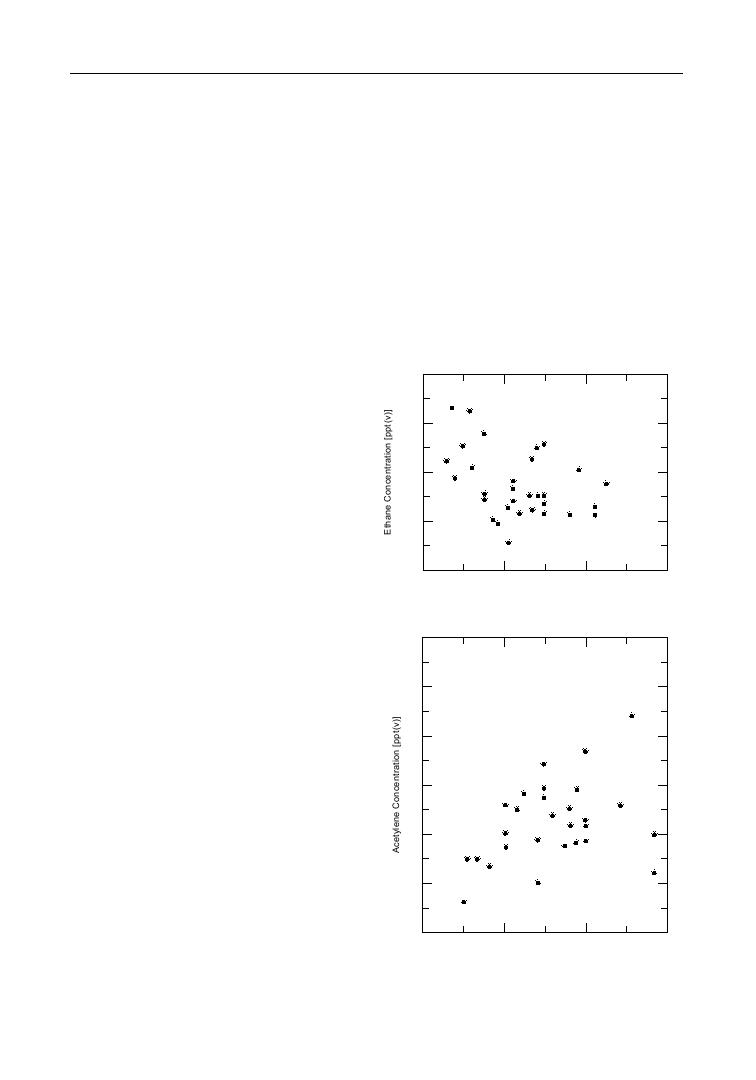
ing AOS-94 the mean ethane concentration
Ethane concentration vs. latitude during AOS-94.
from 73 to 80N was 836 68 pptv on the Pa-
100
cific side of the Arctic Ocean. This agrees well
with the concentrations observed during the
1988 ABLE 3A aircraft study based at Barrow,
90
Alaska. Farther north, from 81to 87N, ethane
concentrations dropped to 726 36 pptv. From
80
87N through the Pole and down to 80N on
the Atlantic side of the Arctic Ocean, ethane
concentrations rose slightly to 765 51 pptv.
70
Propane concentrations followed a similar pat-
tern for the three areas. Acetylene concentra-
60
tions were initially 56 6 pptv and rose slightly
to 6465 pptv in the high-latitude and Atlantic-
50
side areas. The Pacific-side data agree well with
those from the 1988 ABLE 3A for Alaska, and
40
the high-latitude and Atlantic-side concentra-
70
80
90
80
Latitude (N)
tions compare very favorably with those for the
Pacific
Atlantic
Norwegian Arctic.
Acetylene concentration vs. latitude during AOS-94.
71


 Previous Page
