EM 1110-2-2907
1 October 2003
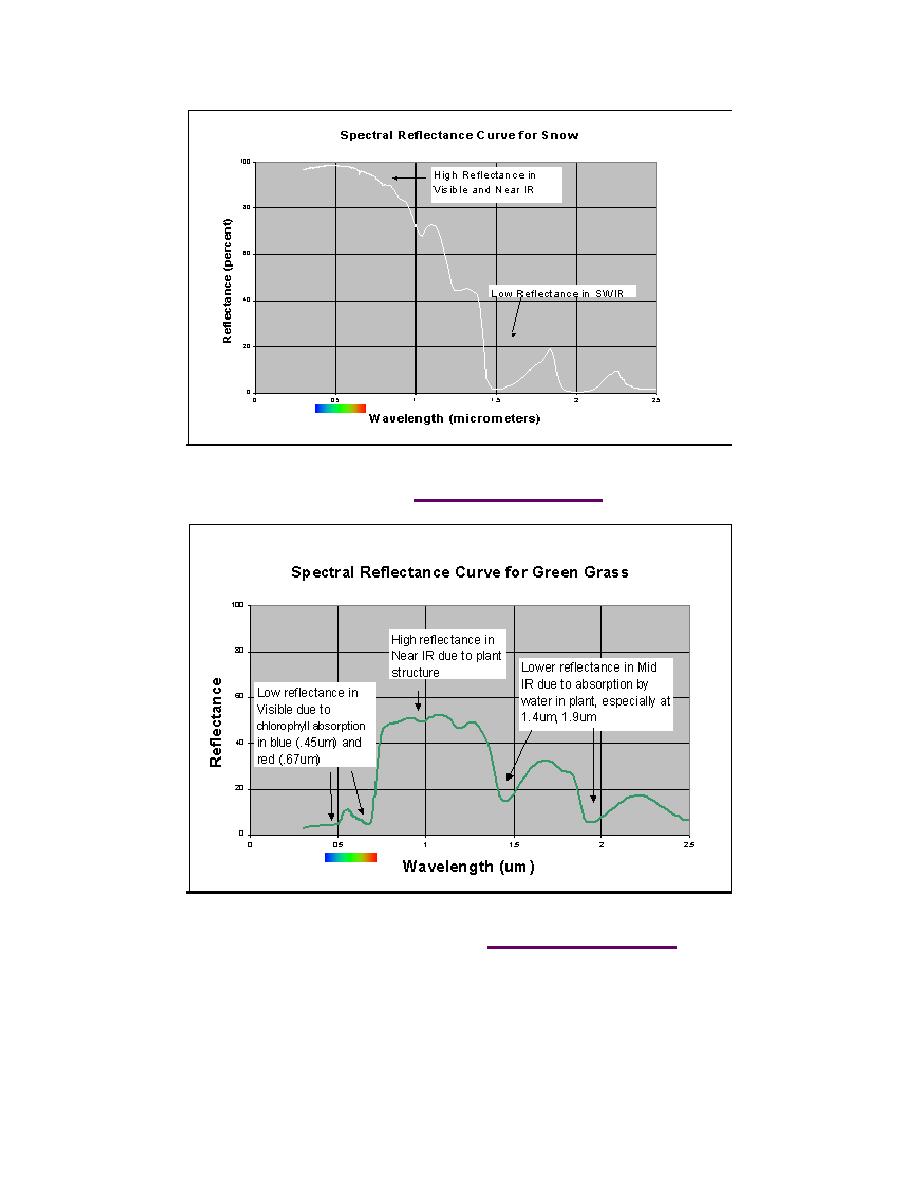
Figure 2-20. Spectral reflectance of snow. Graph developed for Prospect (2002 and
2003) using Aster Spectral Library (http://speclib.jpl.nasa.gov/) data
Figure 2-21. Spectral reflectance of healthy vegetation. Graph developed for Prospect
(2002 and 2003) using Aster Spectral Library (http://speclib.jpl.nasa.gov/) data
(4) Spectral Reflectance of Soil. Soil reflectance (Figure 2-22) typically increases
with wavelength in the visible portion of the spectrum and then stays relatively constant
in the near-IR and shortwave IR, with some local dips due to water absorption at 1.4 and
1.9 m and due to clay absorption at 1.4 and 2.2 m (Lillesand and Kiefer, 1994).
2-25


 Previous Page
