72
ERDC/CRREL TR-02-14
1895
1890
1885
1880
1875
Oct-98
Jan-99
Feb-99
Apr-99
1870
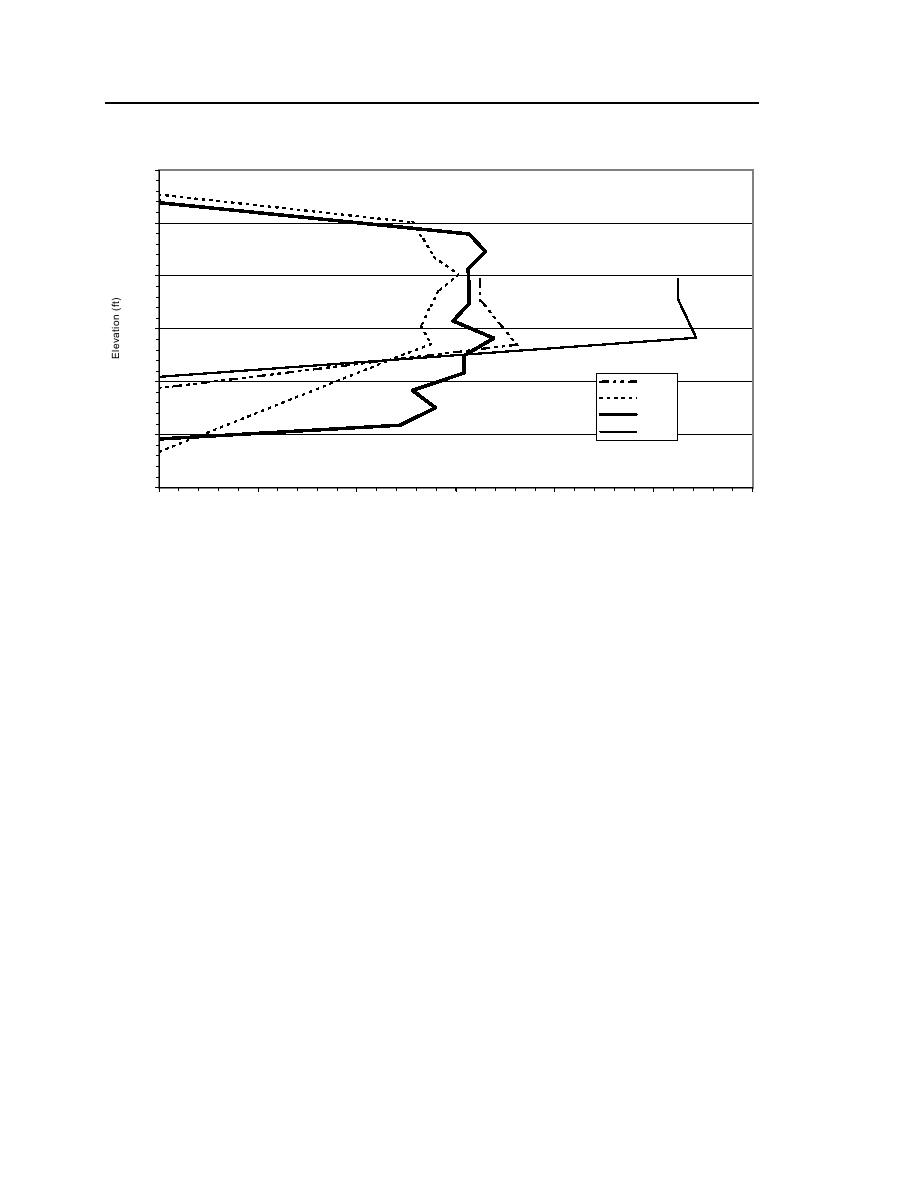
Location: North Channel, upstream cross section approximatly mid-channel
1865
0
1
2
3
4
5
6
Water Velocity (ft/s)
Figure 48. Velocity distributions at approximately the middle of the north channel on the
upstream cross section (RM 1620.45, approximately station 1+00).
TDR measurements
The TDR plots, the flow stage records for the Culbertson site, and the flow
discharge records from Fort Peck Dam provide useful additional insight into the
channel's response to ice cover formation, presence, and breakup at the site.
The images captured using the 1503 TDR on TDR 1, located on the north
bank of the north channel, are shown in chronological order as a waterfall plot in
Figure 49. The increased flow resistance produced by ice cover formation
increased the flow stage and upset the system equilibrium so that the bed started
to scour. Converting the image data from 11 January to engineering units using
eq 6 indicates that 0.62 ft of the probe was exposed (the top of the probe was
approximately 0.2 ft above the riverbed when it was installed on December 16).
As the ice cover thickened, it became more rigid and fixed the cross-sectional
area of flow. Increases in flow rate caused an overall increase in the bulk velocity
of flow, thereby increasing the flow drag on the channel bed, which locally
scoured the bed. Bed erosion continued until 31 January, when the converted
measurements indicated that about 1 ft of the probe had become exposed.
With time, as the cover thickened thermally, its underside became smoother,
and flow resistance along the cover underside diminished. Combining this reduc-


 Previous Page
