RIVER ICE INFLUENCES ON FORT PECK REACH, MISSOURI RIVER
69
through the north subchannel than through the south subchannel. Eventually the
flow area in the north subchannel enlarged by localized scour. In so doing, the
flow undercut segments of the subchannel bank and the sides of the vegetated
medial bar in the north subchannel. When the ice cover eventually broke up and
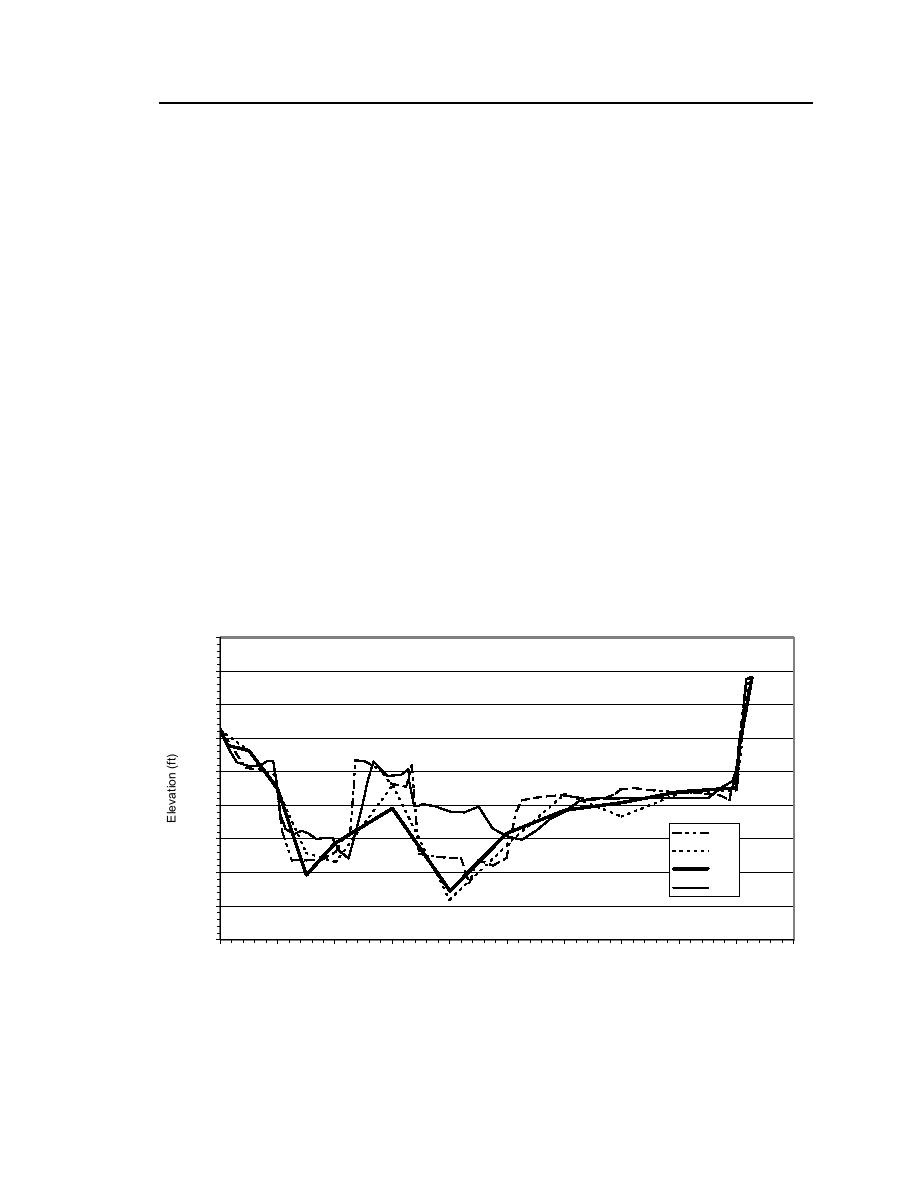
flushed from the north subchannel, the vegetated bar washed out. The TDR
measurements indicate that the channel was eroded to compensate for the greater
roughness of the ice cover. The rate of erosion diminished as the channel
re-established equilibrium.
Ice cover thickness
Because of how the ice cover formed, the cover thickness varied over the
site. Over most of the study area, the cover was 1620 in. thick during the
January survey and thickened only slightly through the rest of the winter; it was
1624 in. thick at the time of the February survey.
The cover was thinnest (about 8 in.) where the flow was deepest and the flow
velocities were greatest; these locations typically were the last to freeze over,
primarily along the thalweg in the north channel (Fig. 46b, c and Fig. 47 ). The
cover was thickest where it formed as bankfast ice over the bar (up to 35 in.)
between the two subchannels and around the bridge piers (about 40 in.) as ice
was incrementally thickened by a cyclic floodingfreezing process.
1910
1905
1900
1895
1890
1885
Dec
1880
Jan
Feb
1875
April
1870
1865
0
100
200
300
400
500
600
700
800
900
1000
Distance Relative to Downstream Left Bank (ft)
Figure 47. Bed profiles of cross sections at RM 1620.4.


 Previous Page
