RIVER ICE INFLUENCES ON FORT PECK REACH, MISSOURI RIVER
63
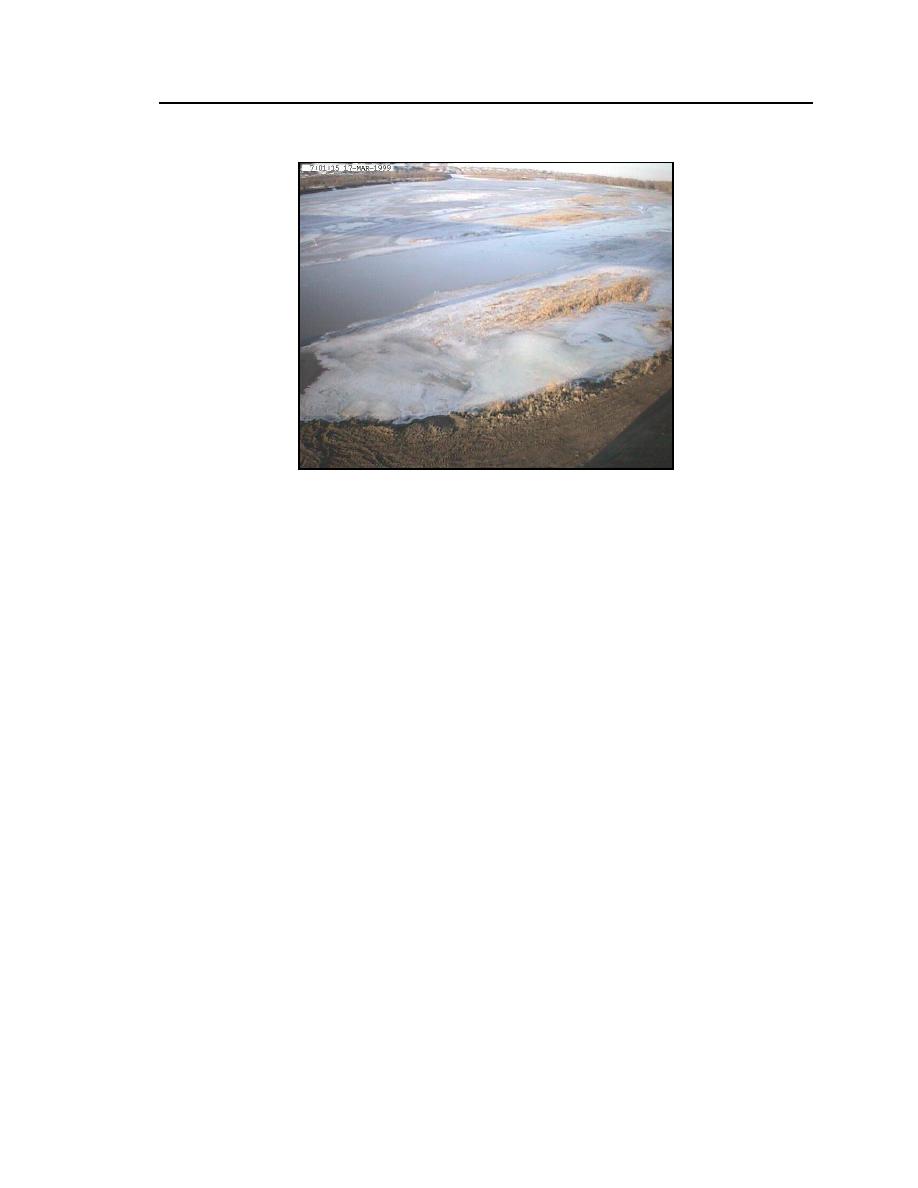
Figure 43. Ice conditions at the Culbertson site on 17
March 1999 in the early stages of breakup.
Flow
Ice cover formation alters the relationship between flow rate and flow stage,
so it was not feasible to assess directly a continuous record of flow rate at each of
the monitored sites. However, the record of flow rate released from Fort Peck
Dam, located about 150 river miles upstream of the monitoring site at Culbertson
water intake (RM 1621), indicates the flow rates at the sites because there is little
additional inflow into the river over the monitored reach during winter. Figure 44
is a record of the daily average flow released from Fort Peck Dam from 1 Octo-
ber 1998 through 1 May 1999. Also indicated on Figure 44 are the dates when
freeze-up and breakup occurred at the Pipal and Culbertson sites. The Fort Peck
discharge was not affected by the ice cover on the river. Also, over each day the
flow released from the dam was steady about the daily average flow rate, reduc-
ing the likelihood of water surges that could lead to fluctuations in the pore
pressure and flexing of the ice along the bank.
In approximate terms, based on average flow velocities through the Fort Peck
reach (Pokrefke et al. 1998), flow released from Fort Peck Dam would travel
about 4050 miles per day. At a rate of, say, 45 miles per day, flow changes at
the Pipal and Culbertson sites on average would lag flow changes at Fort Peck
Dam by 1.5 and 3 days, respectively. Haydon (1931) suggested that the flood
peaks traveled the reach at a rate of 45 miles per hour, or about 80100 miles
per day. These estimates are useful in assessing actual water discharge at the


 Previous Page
