ring with a metal spatula to disperse the soil, the sol-
charged-couple device (CCD) 2048 linear array detec-
vent/extract is allowed to separate, and 4.2 mL of the
tor (Ocean Optics, Inc., Dunedin, Florida). A tungsten-
clear solvent phase is decanted into a specially designed
halogen bulb gives full-spectrum light energy that is
optical cuvette (a mark on the wall of the vessel denotes
focused on the catalyst after it passes through a fiber
the correct volume). Next, 0.5 g of aluminum trichloride
optic transmission line, and the energy that is not
is poured into the cuvette, which is then capped. The
absorbed by the sample is reflected back to the detector
cuvette is intermittently shaken for periods of 15 seconds,
for measurement. Both the light source and detector
over a 2- to 3-minute period. Lastly, the catalyst is allowed
are directed at the catalyst through the bottom of the
to settle to the bottom of the cuvette, creating a 1- to 2-
cuvette. The cuvettes are manufactured specifically for
cm-thick layer.
this spectrophotometer, and have a fused optical bot-
tom that provides a flat surface for the transmission of
Water sample preparation
light. In addition, these vessels were marked on the wall
For water samples, the kit instructions recommend
for proper orientation in the spectrophotometric analy-
transferring 500 mL to a separatory funnel, followed
sis chamber.
by 5 mL of carbon tetrachloride. The capped separatory
The signal obtained by the detector is processed by
funnel is then gently agitated to completely intersperse
notebook computer, which gives nearly instantaneous
this immiscible solvent throughout the aqueous phase
analysis of the intensity over a specified wavelength
while periodically venting to release any pressure build-
interval. In general, the amount of reflectance measured
up. This extraction step takes 3 minutes; then the sepa-
by the detector is inversely proportional to the amount
ratory funnel is returned to a ring stand to allow the
of a petroleum product in the environmental matrix
solvent to separate. While the solvent separates from
being tested. In addition, since the detector is capable
the water phase, the stem of the separatory funnel should
of measuring discrete energies of the chromophoric
be dried with a rolled up paper towel. Once the solvent
(color-producing) Friedel-Crafts reaction products from
settles to the bottom of the funnel, this layer is drained
different petroleum fuels, oils, and solvents, this tech-
into a cuvette, filling it to the 4.2-mL mark. After the
nique potentially allows for a qualitative interpretation.
cuvette is checked for water droplets clinging to the
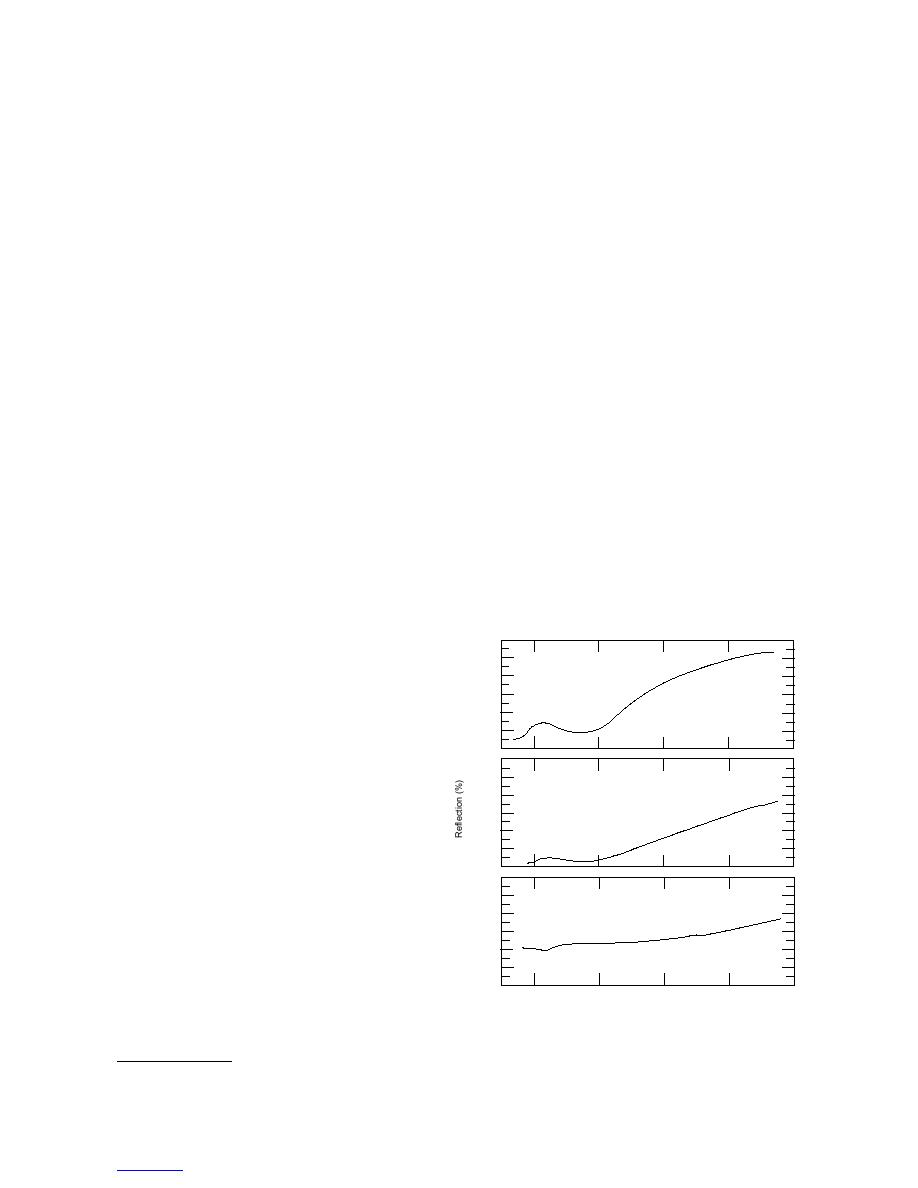
Figure 1 shows some energy spectra obtained with the
walls (if water is present, the solvent should be trans-
HM 2000 for gasoline- and diesel-fuel-contaminated
ferred to a second optical tube), 0.5 g of aluminum
soil samples. Samples were measured with the HM
trichloride is added and the cuvette capped and shaken
as described previously.
120
100
Gasoline 510 ppm TPH
Visual analysis
80
The sample preparation steps for soil and water sam-
60
ples are identical for both the visual and HM 2000
40
methods, with the exception of the amount of catalyst
20
that is used. The reference photo color charts (standards)
0
120
supplied with the kits for the visual analysis were made
100
by preparing samples with known concentrations of
80
commercial petroleum products and processing them
60
through the steps appropriate for either a soil or water
Gasoline 1100 ppm TPH
40
matrix. When these standard charts were made, 1.0 g
20
of aluminum trichloride was used for the Friedel-Crafts
0
reaction, twice the amount that is currently used. To
120
correct for the decreased volume of catalyst, it is rec-
100
ommended that photo chart concentration be halved,
80
after the sample's color intensity is matched to the
Diesel 401 ppm TPH
60
chart.* The visual assessment should be made about 4
40
minutes after adding the catalyst.
20
0
HM 2000 analysis
400
500
600
700
800
Wavelength (nm)
The HM 2000 measures reflectance in the visible
region (400750 nm) of the energy spectrum using a
Figure 1. Energy spectra obtained with the HM 2000
for gasoline- and diesel-fuel-contaminated soil
* Personal communication with John Hanby, H.E.L.P., Inc, 1999.
samples.
2


 Previous Page
