1,200
40-mm
Copper
1,000
800
600
40-mm
Background
TOW
400
TOW
40-mm
TOW
200
40-mm
40-mm
0
0.01
0.1
1
5
10
20 30
50
70 80
90 95
99
99.9
99.99
Percent
a. Copper
300
TOW
Zinc
250
TOW
200
TOW
150
TOW
TOW
100
TOW
Mortar
Background
SADARM
50
0
0.01
0.1
1
5
10
20 30
50
70 80
90 95
99
99.9
99.99
Percent
b. Zinc.
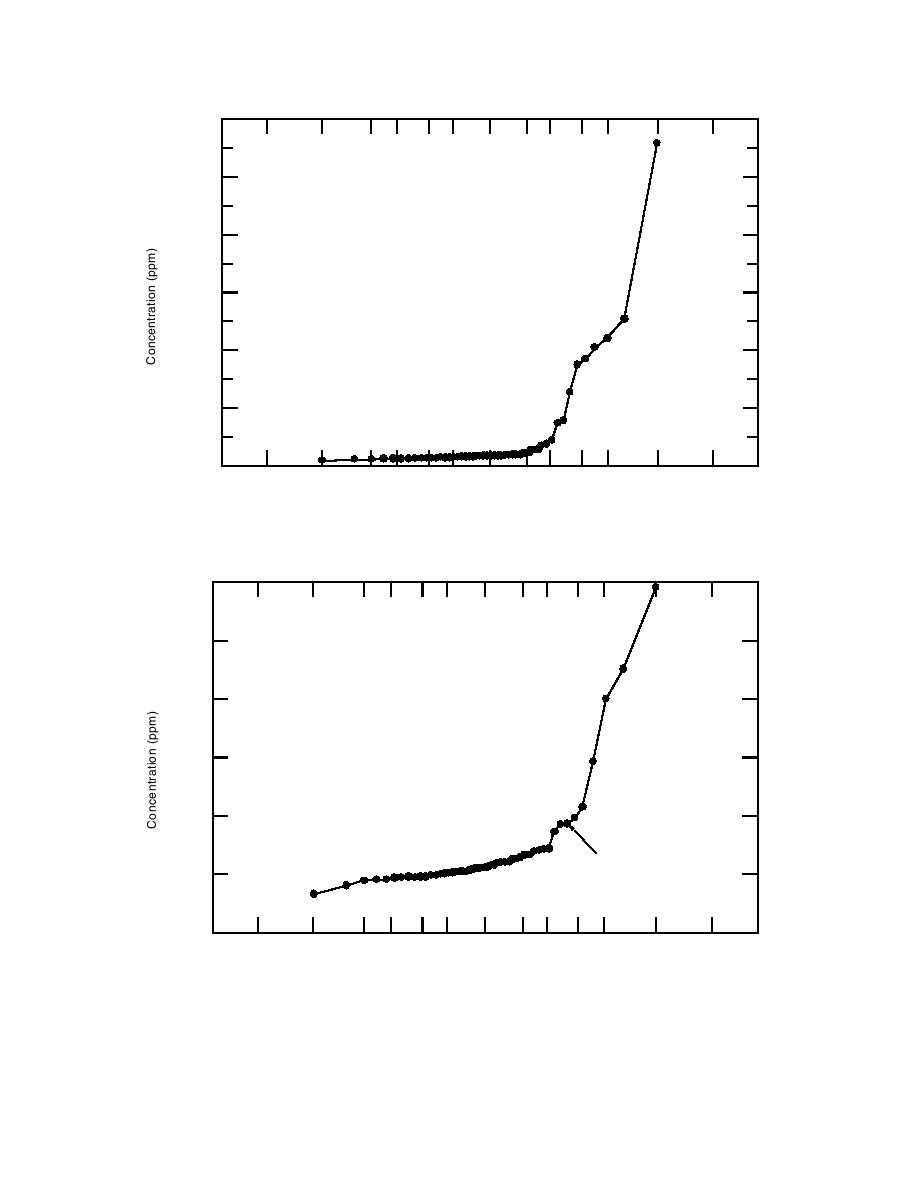
Figure 24. Probability plots of metal concentrations found in samples. The highest con-
centrations are labeled with the events associated with the soil sample. Normal (Gaussian)
populations would fall on a straight line.
29


 Previous Page
