Ice Engineering
U.S. Army Engineer Research and Development Center, Hanover, New Hampshire
Ice Jams, Winter 20022003
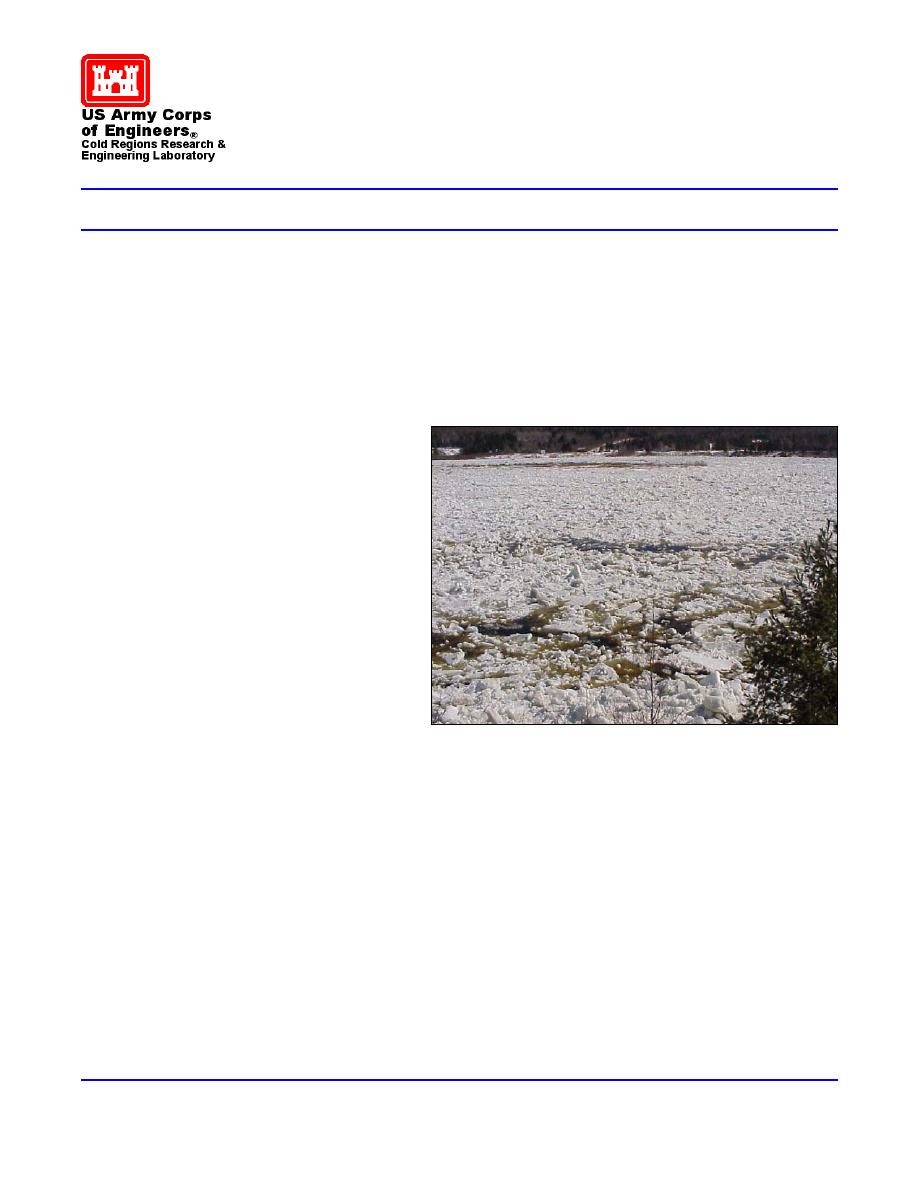
Ice jams are accumulations of ice in rivers, lakes, and streams (Fig. 1) that can cause destructive floods upstream that are
costly to surrounding communities. Areas downstream from the jam also can be affected if the jam releases suddenly,
sending a surge of water and ice downstream. The rapid changes in water levels associated with jams often leave little time to
prepare for flooding. Damages caused by ice jams can be extensive, affecting roads, bridges, buildings, and homes.
Emergency aid and evacuation during ice jam flooding can be delayed or limited because roads and runways may be forced
to close and bridges damaged or destroyed. Disruption of commerce on ice-jammed rivers can temporarily halt transportation
of heating fuel and other necessary cargo.
Ice movement also affects the environment and
can cause severe erosion of riverbeds and banks.
Wildlife, fish habitat, and vegetation can be
adversely affected by ice. It has been estimated that
ice jam damages have cost the United States more
than 0 million annually.
Engineers at the U.S. Army Engineer Research
and Development Center's Cold Regions Research
and Engineering Laboratory (ERDC-CRREL) have
been working to develop and optimize low-cost
structural and nonstructural techniques, such as early
warning systems, ice dusting, ice breaking, ice
weakening, and ice jam removal techniques, to
prevent or alleviate damages caused by ice jams.
Methods of predicting ice jam occurrence and
severity are also being developed.
These efforts rely on data included in ERDC-
Figure 1. Ice jam on the Saint John River at Dickey, Maine, on 17
CRREL's Ice Jam Database (White 1996). Currently
April 2003. Photo courtesy of Mark Turner, NWS.
there are over 14,100 entries in the database, with the
earliest occurring in 1780. ERDC-CRREL's database is a reliable resource used to research previous ice jams and to assess
specific situations that may cause ice jam formation. Each entry includes river name, location, U.S. Geological Survey
(USGS) hydrologic unit code, USGS gage number (if available), jam type and date (if known), local and ERDC-CRREL
contacts, a summary of the event, and a list of publications on the jam. The database also can serve as a source of
documented responses from engineers and officials who helped relieve the emergency situations.
This issue provides a brief summary of ice jam data for water year (WY) 2003 (1 October 2002 through 30 September
2003) collected in the ERDC-CRREL Ice Jam Database. There are 137 entries in the database for this year. A substantial
amount of the information on ice jams in 2003 came from National Weather Service Bulletins. Other sources include ERDC-
CRREL contacts, the USGS, and Internet sites.
When Did Ice Jams Occur in 20022003?
During WY 2003, ice events most frequently occurred in the month of March, accounting for 46% of the total ice events.
February was the second most common month, with 22% of ice jams, most occurring between the second and 27th. January
had a total of 14%, while the months of December, April, May, and November all had less than 20% combined (Fig. 2).
ERDC/CRREL Technical Note 04-5
July 2004


 Previous Page
