stations, which rely on manual measurements. Periods of record longer than 20 years are desired to reduce
uncertainty in statistical analysis.
2.
Obtain historical minimum and maximum daily air temperatures for the NWS station selected. This information
can be obtained through NCDC or the local NWS Forecast Office.
3.
Set up a spreadsheet calculating FDD and net AFDD for each winter, with time in Julian Days (JD) beginning
with October 1 (i.e., October 1 = JD 1, October 2 = JD 2, etc.). When average daily air temperature is above 0F
(as is the case for many days in October, November, and December), the FDD will be negative. AFDD do not
begin accumulating until the first sustained period of cold temperatures. Alternatively, FDD and net AFDD are
calculated for some locations. For example, the U.S. Army Corps of Engineers St. Paul District River Ice
Network provides seasonal AFDD information for selected stations in the upper Midwest (http://www.mvp-
wc.usace.army.mil/ice/afdd/). ERDC-CRREL often has calculated this information in connection with projects
for Corps Districts or other customers.
4.
Identify the maximum net AFDD for each winter and the date of the maximum AFDD in JD.
5.
Estimate maximum ice thickness for each year based on the maximum net AFDD using the modified Stefan
equation. The coefficient used in the Stefan equation may be verified or modified after comparing estimated-to-
measured ice thickness, if measurements are available. The ERDC-CRREL Ice Jam Database
(http://www.crrel.usace.army.mil/ierd/ijdb/) contains some information on ice thickness; other information may
be available from the local office of the U.S. Geological Survey, hydropower facilities, or other state or local
agencies.
6.
Perform a statistical analysis to select the design ice thickness. Generally, the mean thickness and the thickness
at the 95% confidence limits are required for design purposes.
Example
As an example, suppose estimates of a thermally grown ice cover are desired for the Peabody River in Gorham, New
Hampshire. Data from the NWS weather station in nearby Berlin, New Hampshire, for the period 1948 to 1969, 1971 to 2000
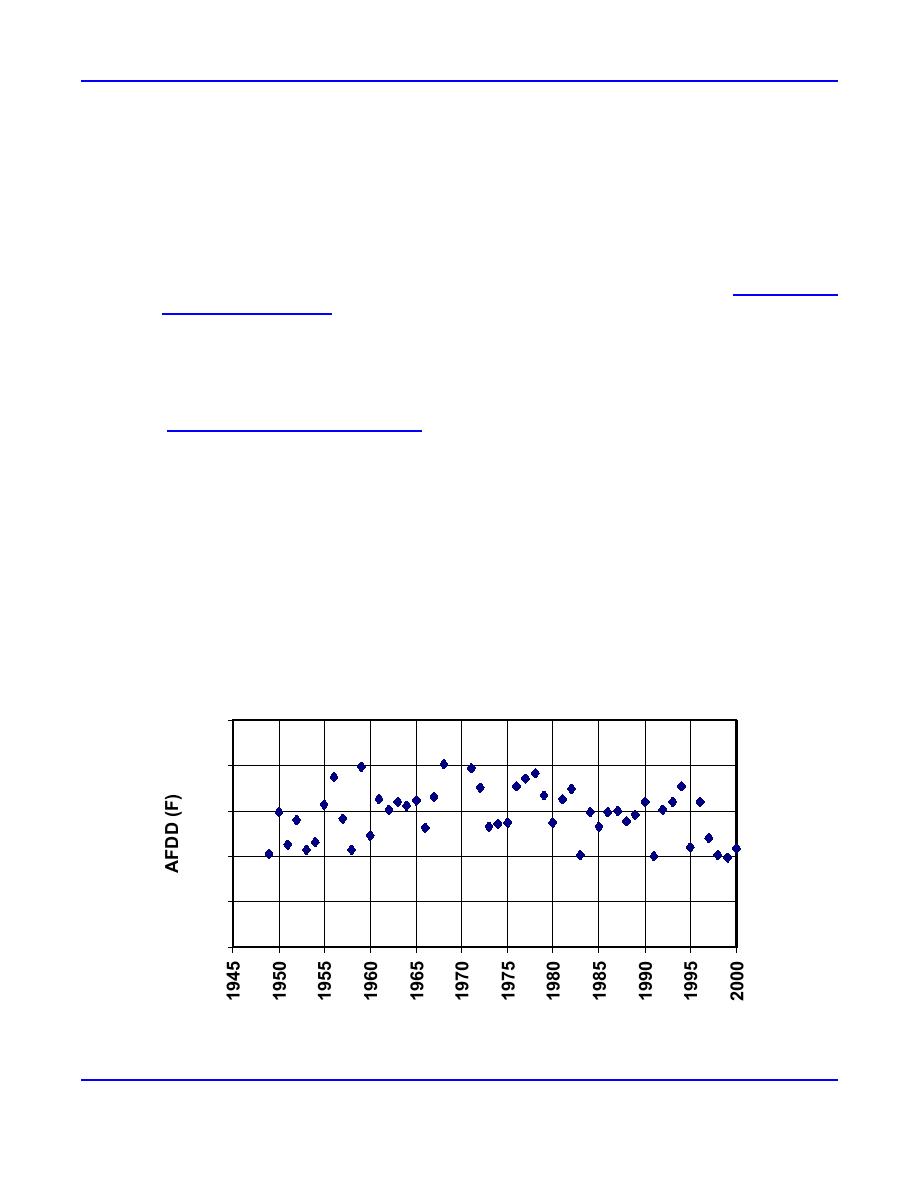
are available. Annual peak net AFDD and the date of the peak net AFDD are shown in Figures 5 and 6. The mean maximum
AFDD is 1463 F days and the mean date of the maximum AFDD is 24 March for this period. The smallest recorded annual
maximum AFDD was 991 F days (17 March 1999), and the largest was 2018 F days (16 March 1968). The date of the
maximum AFDD is rather late for New England and ranges between 1 March (1958) and 13 April (1972), with a mean date
of 24 March for this period.
2500
2000
1500
1000
500
0
Year
Figure 5. Net AFDD data calculated for Berlin, New Hampshire, NWS station.
4
ERDC/CRREL TN-04-3


 Previous Page
