2500
2000
1500
1000
500
0
150
160
170
180
190
200
Julian Day (Oct 1 is JD 1)
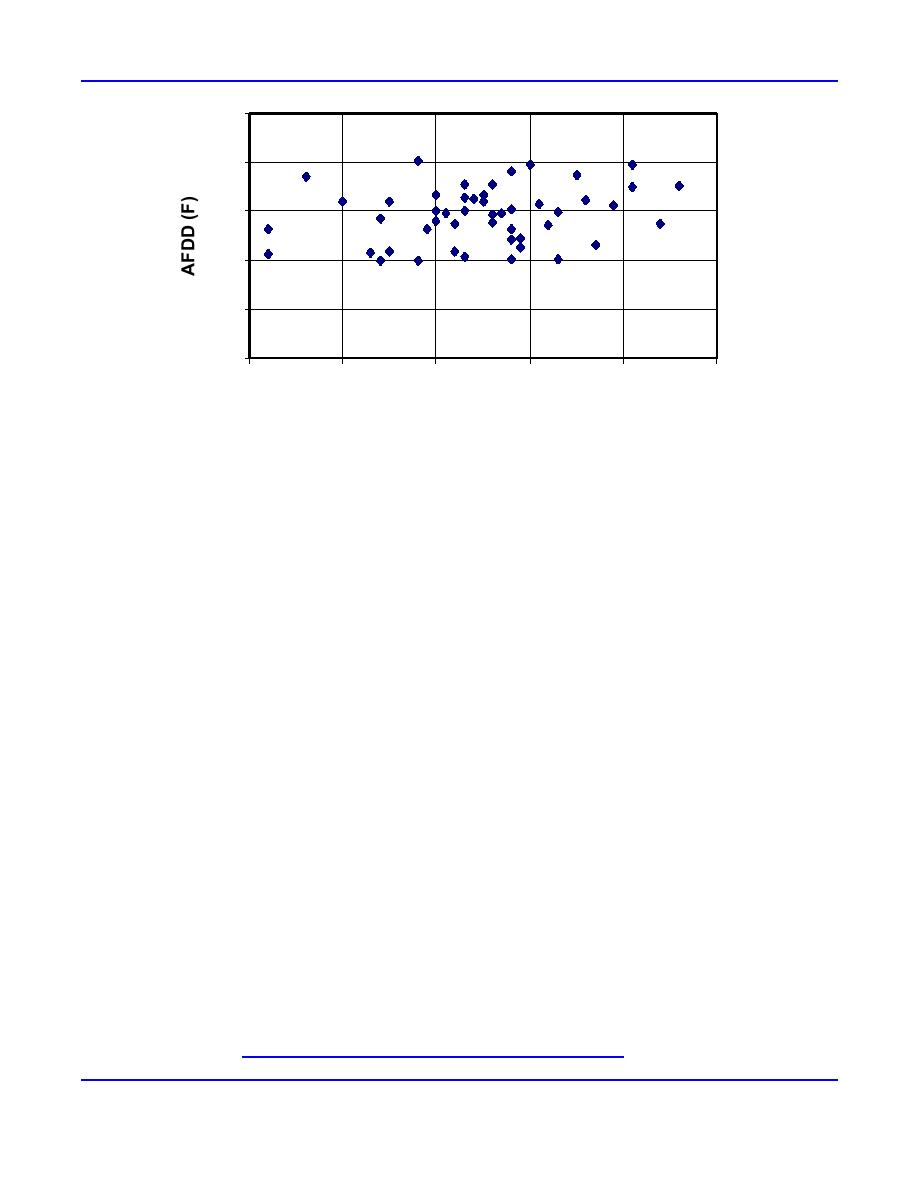
Figure 6. Date of maximum net AFDD, Berlin, New Hampshire.
Assuming a coefficient of 0.41 for this relatively sheltered small river, the maximum thermally grown ice thickness of
the Peabody River would be expected to range between 13 inches and 18.4 inches, with an average of 15.7 inches. However,
this steep, turbulent river produces large amounts of frazil ice in early winter, which tends to deposit beneath the ice cover,
thickening the ice compared to a thermally grown ice cover. On the other hand, large amounts of snow fall in the region,
insulating the ice cover, and thus decreasing the thickness compared to a thermally grown ice cover.
The reasonableness of the coefficient was checked by measuring the ice thickness at five locations on the Peabody River
in mid-January 2001. Measurements ranged from 10.5 inches at the upstream end of the study reach to 22.5 inches at the
downstream end of the study reach, averaging 18.4 inches. Observed snow cover on top of the ice ranged from 36 inches
where the ice was thinnest to 24 inches near the lower end of the study reach, averaging 32 inches. AFDD at the time was
688 F days, corresponding to an estimated thickness of 10.7 inches as a result of thermal ice growth using the coefficient of
0.41. Based on the observed ice thickness, and considering both the snow cover and frazil deposition at this location, a
coefficient of about 0.7 fits the observed ice thickness and would be considered reasonable for this site.
Conclusion
Estimates of ice cover thickness are often necessary for hydraulic analyses of ice-affected rivers or for design of bridges
or other riverine structures. Although ice cover formation and growth can be a highly complex and variable process,
estimates of ice cover thickness can be made using meteorological data. The modified Stefan equation is suitable for use in
estimating ice thickness in many cases. Whenever possible, the estimated ice thickness at a particular site should be
compared to actual ice thickness observations to evaluate the reasonableness of the coefficients given the physical processes
governing ice cover growth.
References
Ashton, G.D. (Ed.) (1986) River and Lake Ice Engineering. Littleton, Colorado: Water Resources Publications.
Beltaos, S. (Ed.) (1995) River Ice Jams. Highlands Ranch, Colorado: Water Resources Publications, LLC.
Bilello, M.A. (1980) Maximum thickness and subsequent decay of lake, river, and fast sea ice in Canada and Alaska.
U.S. Army Cold Regions Research and Engineering Laboratory, Hanover, New Hampshire, CRREL Report 80-6.
National Weather Service (2001a) NWS, Pittsburgh, Pennsylvania, flood warning, 5:30 p.m., 31 January 2001.
National Weather Service (2001b) NWS, Pittsburgh, Pennsylvania, flood warning, 9:01 p.m., 31 January 2001.
Silver, J.D., and M.A. Fuoco (2001) Ice takes a jewel away from McKeesport's shore. Pittsburgh, Pennsylvania: Post-
Gazette, 2 February 2001 (http://www.post-gazette.com/regionstate/20010202marina2.asp).
ERDC/CRREL TN-04-3
5


 Previous Page
