limited tests, the flow coefficient for crushed
from 19 to 25 mm, 25 to 9.5 mm, and 9.5 mm to no.
gravel was 92.2 and for crushed stone was 115
4 are tested separately and the UCV averaged
(Janoo 1998).
from the individual fraction sizes. As shown in
Figure 11a, the modified NAA method developed
by Aldrich (1996) for the coarse fraction of the
Characterization summary
In summary, it was found that several methods
HMA mixture clearly indicates that the UCV in-
are available for characterizing the shape, angu-
creases with increasing percent of crushed coarse
larity, and surface texture of HMA aggregates. It is
particles. In addition, Aldrich (1996) showed a
good correlation between the results from the
difficult to separate the effect of individual fea-
modified NAA test for coarse aggregates and the
tures of the aggregate, with the exception of petro-
particle index value (Figure 11b). Overall, this is a
graphic methods. All of the tests tend to provide
fairly simple test to conduct, and correlation be-
the effect of the overall shape, angularity, and
tween rutting potential and aggregate character-
roughness. The NAA and modified NAA tests
ization can be easily developed.
seem the easiest to use and implement. The time
flow test used by the Quebec Ministry of Trans-
portation also appears to be easy to implement.
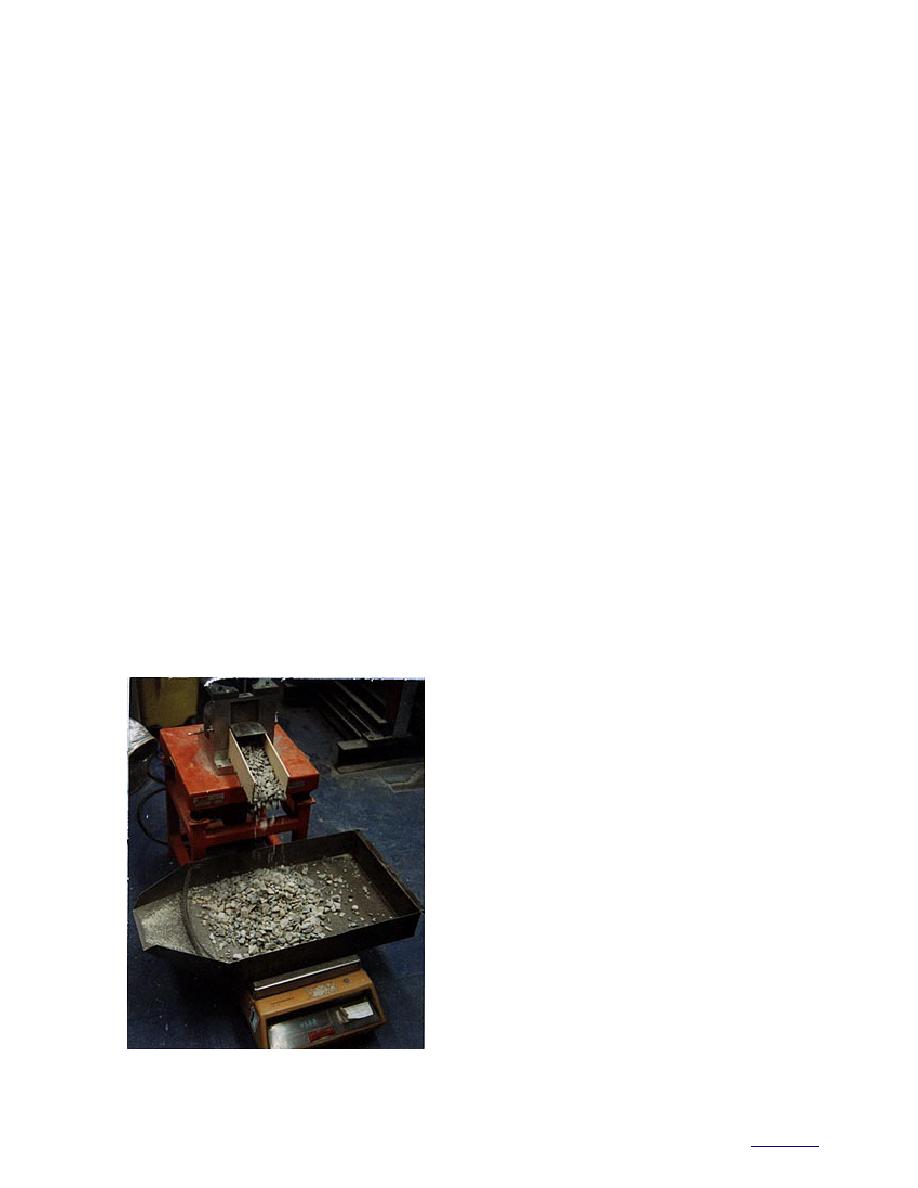
Time index
Similar in concept to the uncompacted void
tests, a test method developed by the Quebec
PARAMETERS INFLUENCING
Ministry of Transportation characterizes the angu-
SKID RESISTANCE
larity and surface texture of aggregates using the
For HMA pavements, skid resistance depends
rate of flow of the aggregate through a known-
diameter opening (Fig. 12). Additional details on
on the friction developed between the pavement
this apparatus can be found in Janoo (1998).
surface and the tire. This friction is dependent on
The index, the flow coefficient (Ce), is a func-
the microscopic and macroscopic roughness of the
tion of the time it takes 7 kg of material to move
pavement surface, the polishwear characteristics
through a 60-mm-diameter opening for material
of the aggregates, and the ability of the surface to
passing the 20-mm sieve and retained on the
drain (Beaton 1976). Marek (1972) reported that
4-mm sieve. A different size is used for the fine
50% of the initial skid resistance is lost during the
aggregates. In addition, the flow coefficient
first two years of pavement service and that the
depends on the bulk specific gravity. Based on
single most important factor that affects the reduc-
tion of skid resistance is the polishing characteris-
tics of the aggregates in an HMA mix. Other fac-
tors that affect the skid resistance of the pavement
surface are wetness of the surface, seasonal varia-
tion, and temperature.
The skid resistance of a wide range of dry sur-
faces is high and fairly constant. When these sur-
faces get wet, however, the skid resistance drops
and is very dependent on the surface type. There
is seasonal variation: the skid resistance is higher
on wet roads during the winter than in the sum-
mer (Hosking and Woodford 1976) because in
winter the road surface is contaminated by sand-
ing and salting and the removal of fine material
increases the roughness of the microtexture. In the
summer, continuous abrasion of the macrotexture
produces fines that coat the microtexture and
reduce the skid resistance.
The friction of the surface is indexed from field
tests following various standardized tests (ASTM
E 274 [1994] and E 1551[1994]). The procedure is
based on measurements of the frictional force
developed between a standard tire at a standard
Figure 12. QMOT time index test apparatus.
inflation pressure and the wetted pavement sur-
9
to contents


 Previous Page
