1,000
TNB
100
10
1
y = 0.81x
r = 0.976
0.1
0.1
1
10
100
1,000
400
DNB
300
200
100
y = 1.04x
r = 0.998
0
100
200
300
400
0
1,500
HMX
1,000
500
y = 0.65x
r = 0.978
0
500
1,000
1,500
2,000
2,500
0
Concentration by HPLC (mg/kg)
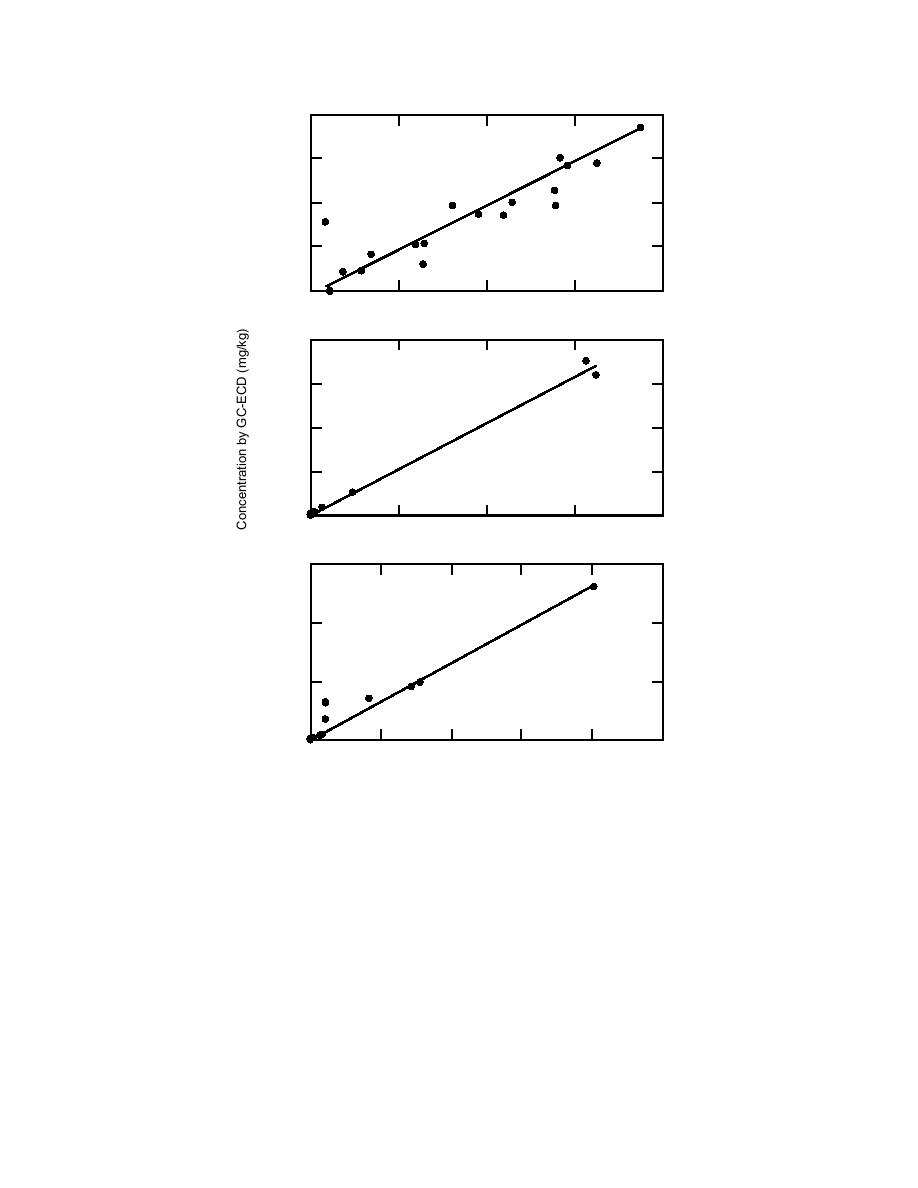
Figure 1 (cont'd). Correlation analysis of GC-ECD concentration (mg/kg)
estimates with those from HPLC-UV analysis using splits of the same ac-
etonitrile extract (2 g soil:10 mL acetonitrile) from archived soils.
confirm analyte identities in complex chromato-
Trace concentrations
Another series of archived soils was selected
grams. This advantage was apparent for one of
for extraction and analysis. For land mine detec-
the Monite soils. Chromatograms from previous
tion, very low (1 g/kg) concentrations may need
HPLC analyses were thought to show a peak for
to be detected, and we selected soils for which
TNT, but TNT was not detected by GC. Rather,
previous HPLC analysis had either shown trace
the GC showed peaks for several isomers of DNT,
(less than the detection limit) concentrations of
one of which (3,4-DNT) co-elutes with TNT using
the standard HPLC analytical separation and an-
either TNT, 2,4-DNT, or RDX, or the soils were
other (3,5-DNT) that coelutes with TNT using the
collected near samples that had trace concentra-
tions. For the extraction of these soils we used 25-
standard confirmation HPLC separation.
6


 Previous Page
