1,000,000
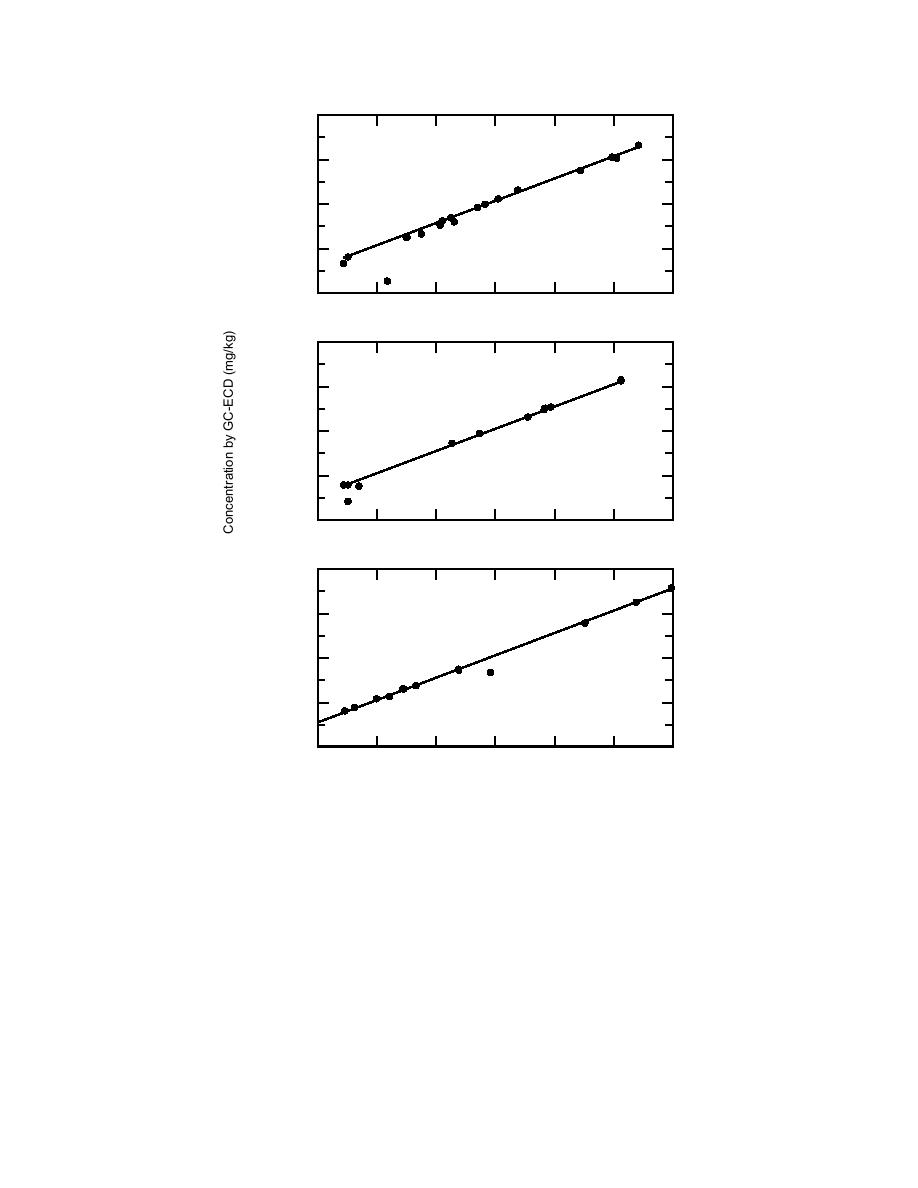
TNT
10,000
100
1
y = 1.35x
r = 0.992
0.01
0.1
1
10
100
1,000
10,000
100,000
1,000,000
RDX
10,000
100
1
y = 1.24x
r = 1.00
0.01
0.1
1
10
100
1,000
10,000
100,000
1,000,000
2,4-DNT
10,000
100
1
y = 1.25x
r = 0.999
0.01
0.1
1
1,000
10,000
100,000
10
100
Concentration by HPLC (mg/kg)
Figure 1. Correlation analysis of GC-ECD concentration (mg/kg) estimates
with those from HPLC-UV analysis using splits of the same acetonitrile ex-
tract (2 g soil:10 mL acetonitrile) from archived soils.
artifact of the experimental error associated with
the first peak to degrade in shape following mul-
tiple injections of water or soil extracts is the HMX
the large dilutions required for GC and the domi-
peak. Despite these problems, we decided that GC
nance of high values on the slope obtained from a
least-squares model. Two other problems were the
analysis of soil extracts was feasible. The GC of-
considerable scatter in the TNB data and the un-
fered two significant advantages over the standard
derestimation of HMX by GC. The TNB scatter is
HPLC method: lower detection levels and im-
most likely due to TNB's instability in solution,
proved chromatographic resolution of the isomers
and the underestimation of HMX is likely due to
of DNT and Am-DNT.
thermal degradation during the GC analysis. Al-
One important advantage of using both HPLC
though accurate GC analysis of HMX is possible,
and GC analysis is the ability to independently
5


 Previous Page
