680
660
640
620
600
580
1953 (Survey)
560
1985 (Survey)
1993 (Landsat)
540
500,000-acre-ft loss
520
0
10,000
20,000
30,000
40,000
50,000
60,000
Surface Area (acres)
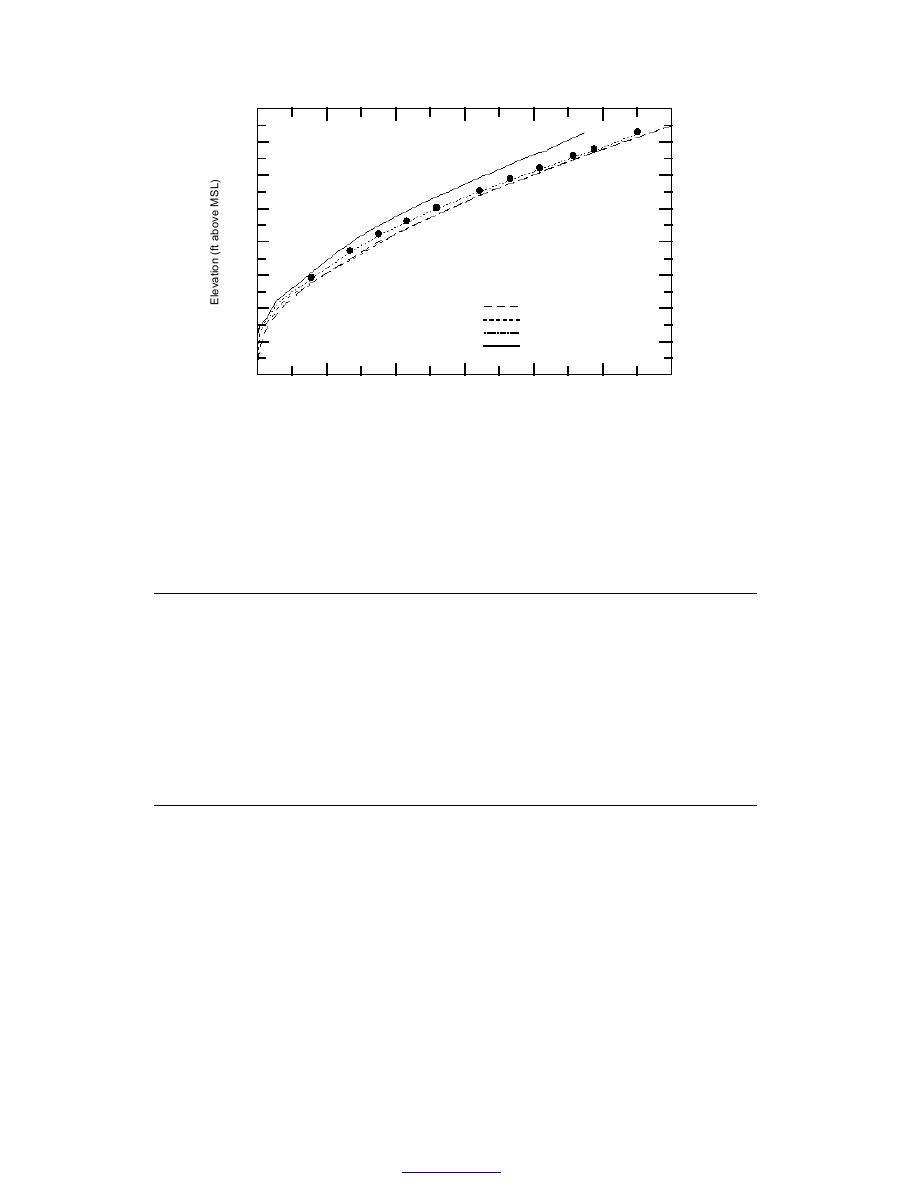
Figure 5. Elevation vs. water surface area graph, with area from 1953 and 1985
surveys, 1993 Landsat estimate, and hypothetical case of 500,00-acre-ft loss of
capacity.
Table 10. Painted Rock Reservoir elevation range from Landsat and from 1993 ground survey
profiles.
Landsat
elevation
Ground survey elevation range
range
1
2
3
4
5
6
7
8
9
10
11
12
Total
1
156
14
0
0
0
0
0
0
0
0
0
0
170
2
6
143
4
0
0
0
0
0
0
0
0
0
153
3
1
12
122
40
0
1
0
0
0
0
0
0
176
4
4
4
14
57
16
0
0
0
0
0
0
0
95
5
1
2
2
8
29
8
0
0
0
0
0
0
50
6
0
0
0
0
10
93
20
0
0
0
0
0
123
7
0
0
1
1
4
29
57
25
0
0
0
0
117
8
0
0
1
0
2
3
8
97
8
0
0
0
119
9
0
0
0
0
1
3
4
24
213
15
0
0
260
10
0
0
0
0
0
1
3
0
12
105
58
0
179
11
0
0
0
0
0
0
0
0
1
19
400
37
457
12
0
0
0
0
0
0
0
1
3
1
24
300
329
Total
168
175
144
106
62
138
92
147
237
140
482
337
2,228
Elevation ranges in above table are as follows:
1 empty to 578.51 ft
7 631.06 ft to 637.75 ft
2 578.51 ft to 594.65 ft
8 637.75 ft to 644.22 ft
3 594.65 ft to 604.88 ft
9 644.22 ft to 651.68 ft
4 604.88 ft to 612.32 ft
10 651.68 ft to 655.24 ft
5 612.32 ft to 620.61 ft
11 655.68 ft to 665.68 ft
6 620.61 ft to 631.06 ft
12 665.68 ft and above
and 1993 of about 157,000 acre-ft at spillway ele-
Storage capacity results
Storage capacity values from the 1953 and 1985
vation (661 ft).
surveys and the 1993 Landsat estimate are listed
in Table 11. Figure 6 graphs the elevation vs. stor-
Sediment depth estimate results
age capacity curves for the 1953 and 1985 sur-
Sediment depth estimates are listed in Table
veys, the 1993 Landsat estimate, and the hypo-
12. Area increment rings correspond approxi-
thetical 500,000-acre-ft-loss. The Landsat estimate
mately to the different classes of the 1993 multi-
shows a loss in storage capacity between 1953
temporal Landsat water classification (Fig. 4).
12
Back to contents


 Previous Page
