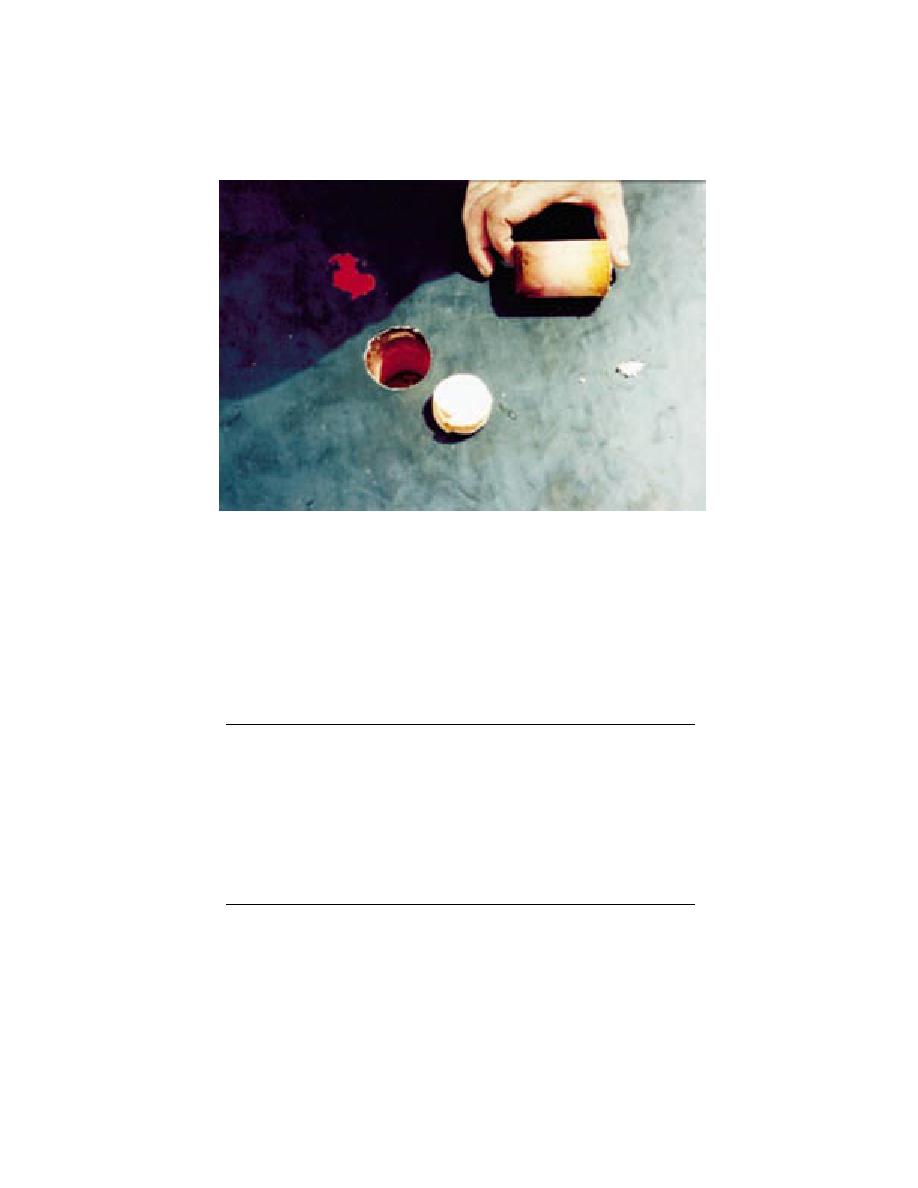
Figure 30. Upper layer of phenolic insulation at core 18.
Table 16. Core sample findings for roof A2.
Moisture
content
Thickness
(% of
TRR
Core
Insulation
(in.)
dry weight)
(%)
Status
17
PHE
3
2542
near zero
WET
17
PHE (frozen)
3
546
25
WET
18
PHE
3
61
68
WET
18
PHE (frozen)
3
326
37
WET
19
PHE
3
2844
near zero
WET
19
PHE (frozen)
3
1962
near zero
WET
20
PHE
3
4
96
dry
20
PHE
3
8
92
dry
Notes:
The TRR of the three samples with moisture contents in excess of 1000%, calculate to less
than zero using information in Tobiasson et al. (1991). Their actual thermal resistivity is
probably close to that of ice (i.e., about 0.06 ft2 . hr . F/BTU. in.). Since the thermal resistiv-
ity of dry phenolic is about 10 ft2 . hr . F/BTU. in., their TRRs, using the value of ice, are
about 1%.
27


 Previous Page
